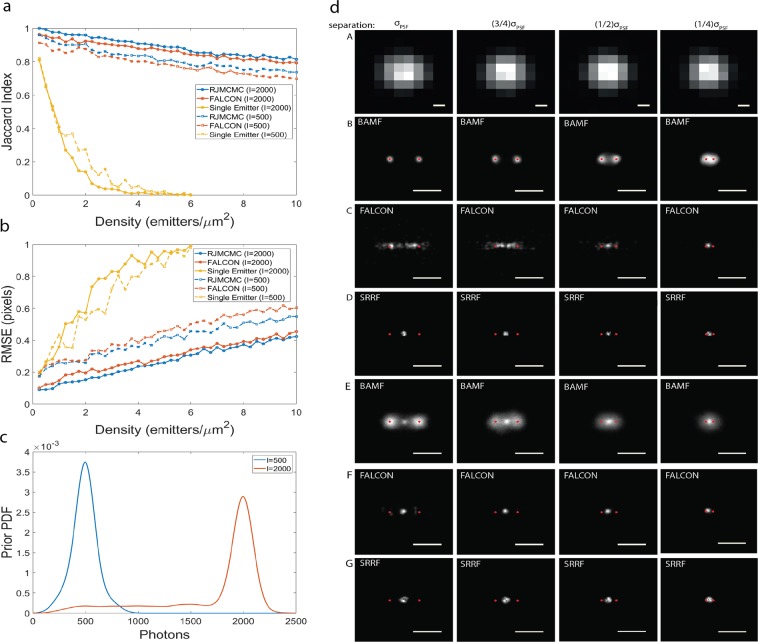
Figure 2.
Jaccard index and localization error (accuracy). (a) Jaccard index, (b) localization errors for BAMF, FALCON and single-emitter fitting using 2,000 and 500 photons per frame. (c) The intensity priors used to analyze the data. To make these plots for BAMF, the MAPN was used from RJMCMC. (d) represents the ability of BAMF, FALCON and SRRF to distinguish two nearby emitters with different separations. Row A shows a frame of simulated data with different separations. Rows B, C and D result from emitters with 2,000 photons, and rows E, F and G show the results from 500 photon emitters. The BAMF super-resolved images are the posterior images containing all the possible models. The scale bars are σPSF.

