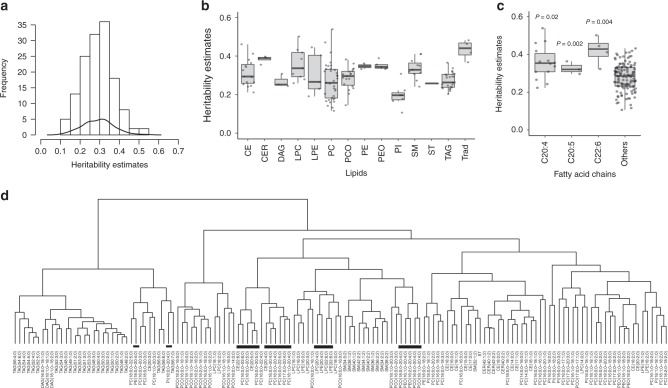
Fig. 2.
Heritability of lipidomic profiles and genetic correlations among the lipid species. a Histogram and kernel density curve showing the distribution of heritability estimates across all the lipid species. b Boxplot showing the heritability estimates in each lipid class. c Boxplot showing comparison of the median heritability estimates of lipid species containing C20:4, C20:5 and C22:6 acyl chains and all others. The P-values were calculated using the Wilcoxon rank-sum test. d Hierarchical clustering of lipid species based on genetic correlations among lipid species. Lipids containing polyunsaturated fatty acids C20:5, C20:4 and C22:6 are highlighted with black bars. The data presented in the boxplots represent the interquartile range (IQR) defined by the bounds of the box with the median (middle line of the box) and whiskers extending to the largest/smallest values no further than 1.5 times the IQR. CER ceramide, DAG diacylglyceride, LPC lysophosphatidylcholine, LPE lysophosphatidylethanolamine, PC phosphatidylcholine, PCO phosphatidylcholine-ether, PE phosphatidylethanolamine, PEO phosphatidylethanolamine-ether, PI phosphatidylinositol, CE cholesteryl ester, SM sphingomyelin, ST sterol, TAG triacyglycerol, Trad traditional lipids

