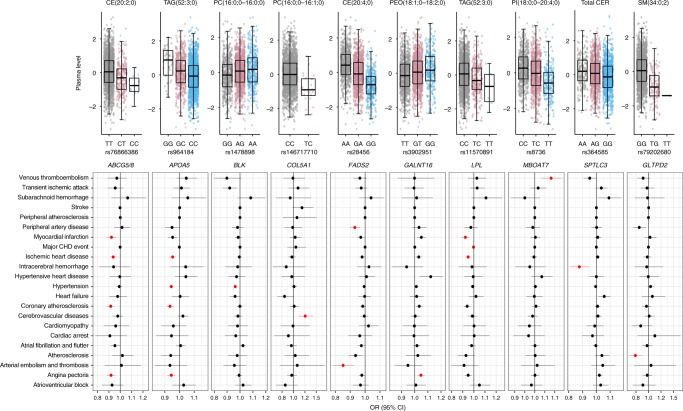
Fig. 5.
Relationship between lipid species-associated variants and risk of CVDs. The upper panel shows the association of the identified variants with the strongest associated lipid species. Boxplots show the interquartile range (IQR) defined by the bounds of the box with the median (middle line of the box) of plasma levels of the respective lipid species for each genotype of the variants; whiskers extend to the largest/smallest values no further than 1.5 times the IQR. The lower panel depicts the relationship between the identified variants with CVD phenotypes. The effect sizes (odds ratio) with 95% confidence interval are plotted with respect to the alternate alleles. The associations with CVD phenotypes highlighted in red colour are significant at FDR <0.05

