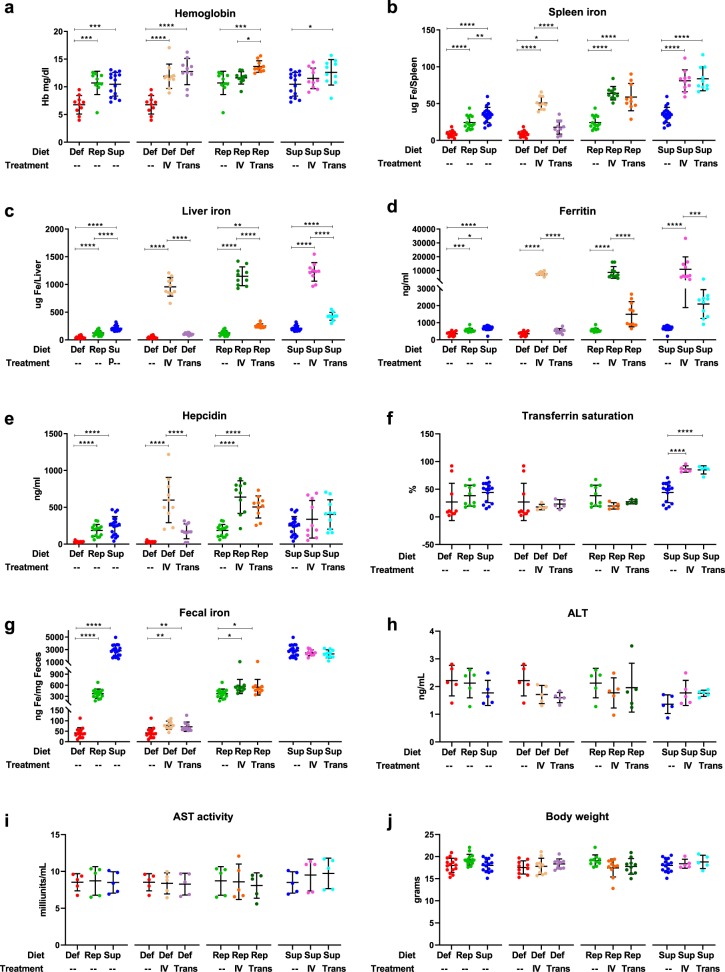
Fig. 1.
Iron status. a–g Iron parameters as labeled in each panel, were measured for each mouse on an iron-deficient (Def; n = 15), iron-replete (Rep; n = 15), or iron-supplemented (Sup; n = 20) diet, with intravenous iron infusion (IV; n = 10 per group) or weekly blood transfusions (Trans; n = 10 per group). Results shown are combined from four separate and complementary experiments. h–i ALT and AST activity in the liver was measured in the same cohorts of mice for one representative replicate (n = 5 per group); j Body weight was recorded in three of the complementary experiments. Dot plots graphs report mean ± SD. *p < 0.05, **p < 0.01, ***p < 0.001, ****p < 0.0001 by one-way ANOVA with Tukey’s multiple comparison test

