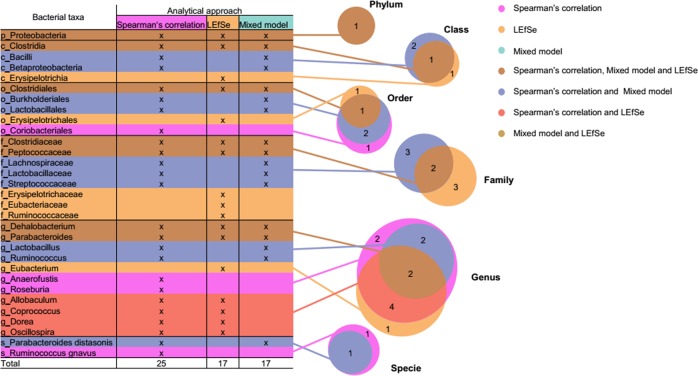
Fig. 6.
Combination of all three approaches used to analyze the effects of iron on the microbiome. Table and Venn diagram indicating the distribution of the bacteria at different taxonomic rank modified by intravenous iron and chronic transfusion that were identified by Spearman’s correlation (25), LEfSe (17) and mixed model analysis (17) from the four complementary experiments. Taxa highlighted in dark gold were identified by all three approaches. p_ = phylum, c_ = class, o_ = order, f_ = family, g_ = genus, s_ = species

