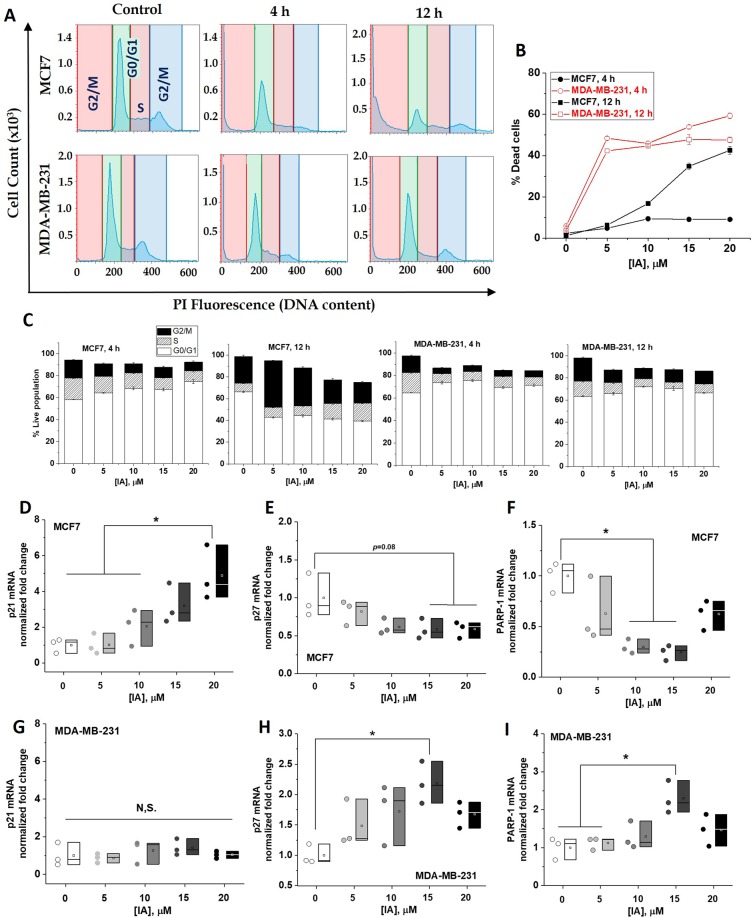
Figure 3.
Differential iodoacetate effects on cell cycle progression and repair genes expressions in MCF-7 and MDA-MB-231 cells. (A) Representative DNA histograms displaying various cell cycle phases for MCF7 and MDA-MB-231 4 and 12 h after treatment with 15 mM IA. (B) Quantification of percentage cell death (sub G1) induced by various [IA] for 4 and 12 h. (C) Bar chart representing the percentage of cell population in MCF7 and MDA-MB-231 after IA treatment at (0–20 µM) for 4 and 12 hrs. (D–I) mRNA expression for both MCF7 (upper row) and MDA-MB-231 (lower row) for p21 (D,G), p27 (E,H), and PARP-1 (F,I). Quantification was carried out over three independent runs. Statistical analyses were carried out using One-way ANOVA where statistical significance was achieved at p < 0.05.

