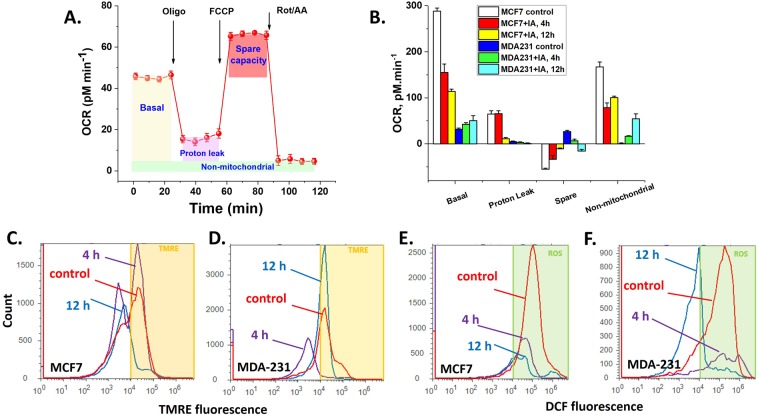
Figure 6.
Effects of IA on mitochondrial bioenergetics, transmembrane potential and ROS production. (A) The Seahorse mito-stress assay. OCR is measured before and after adding inhibitors/uncoupler to induce different mitochondrial respiratory states (defined in the shaded areas). (B) Basal respiration, proton leak, spare capacity, and non-mitochondrial respiratory rates (defined in A) were quantified and compared for both cell types after 4 or 12 h of treatment with 20 mM IA. (C,D) Effect of IA-treatment time on mitochondrial transmembrane potential as determined by flow cytometric analysis using TMRE staining for both MCF7 and MDA-MB-231 cells; respectively. (E,F) Flow cytometric analysis of cellular ROS levels using DCF cellular staining of both MCF7 and MDA-MB-231 cells; respectively.

