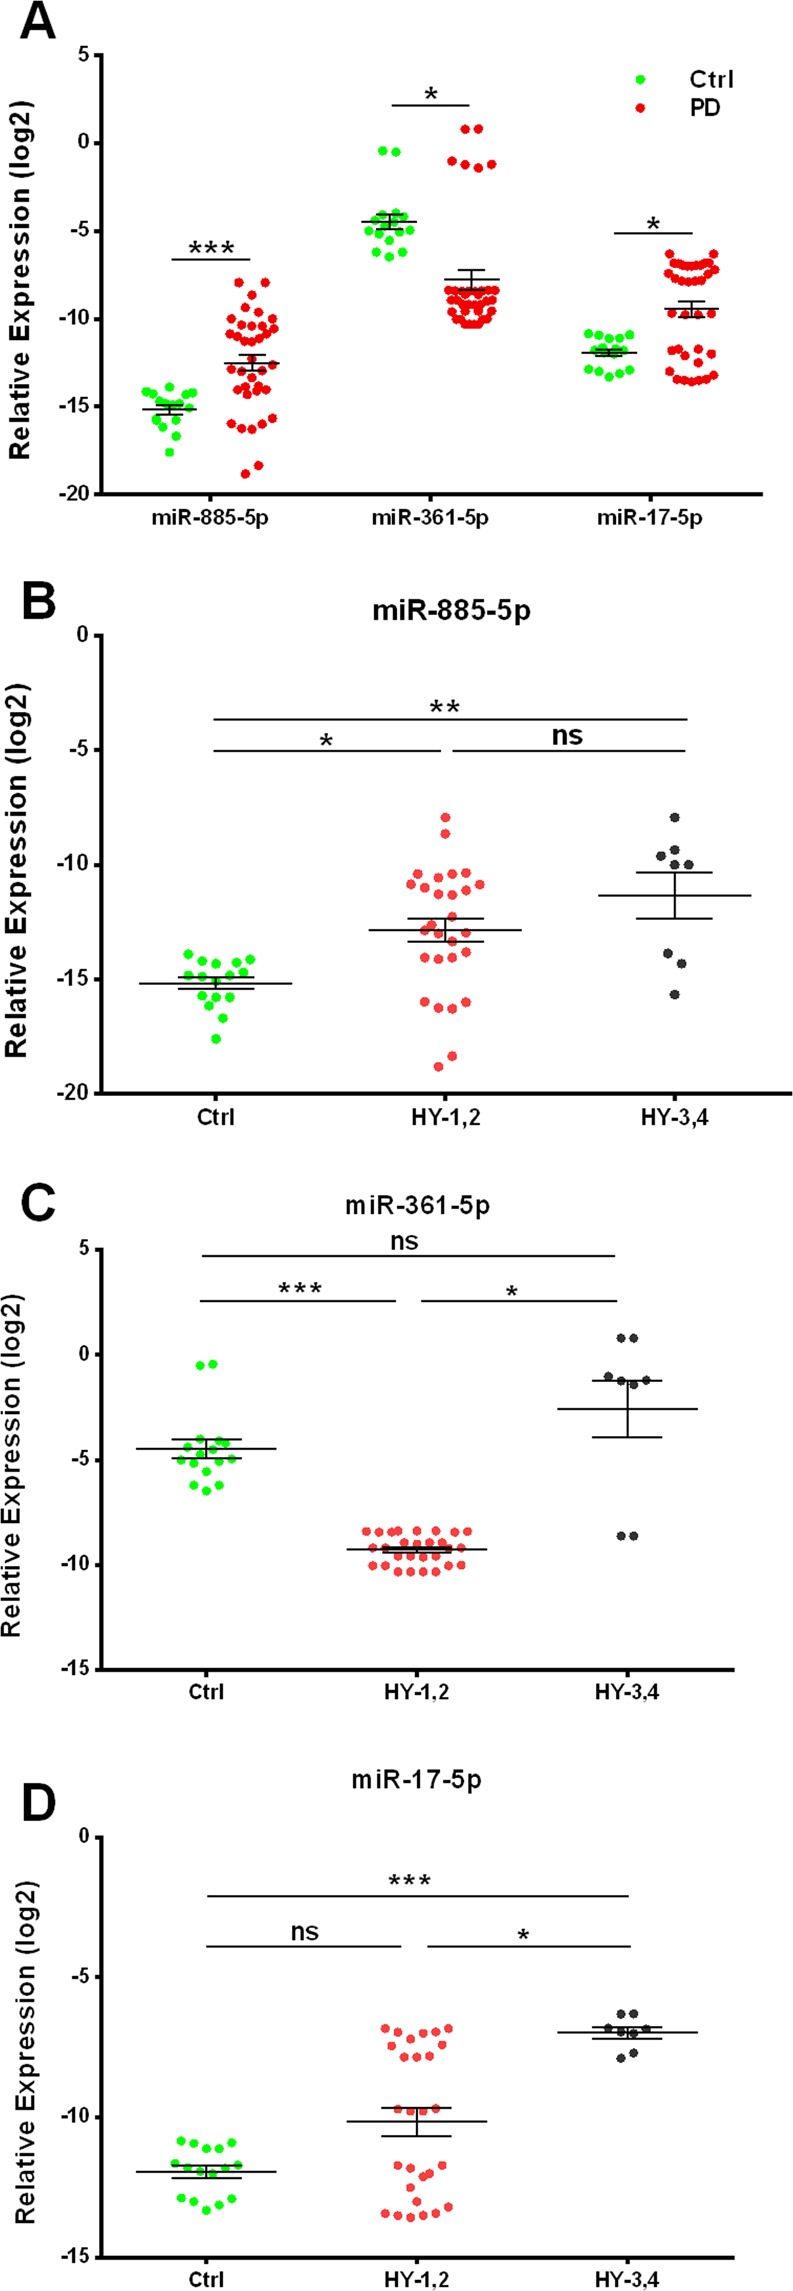
Figure 1.

Assessment of the relative expression levels of miR-885-5p, miR-361-5p and miR-17-5p in the PBMCs of: (A) control subjects and PD patients. (B–D) Control subjects and early (HY-1,2) and advanced (HY-3,4) stage PD patients based on Hoehn & Yahr stages. Data are presented as the mean ± SEM. Differences were analyzed by the Mann-Whitney U test (A) and the Kruskal-Wallis H test (B–D) (***p ≤ 0.001, **p ≤ 0.01, *p ≤ 0.05, and ns p > 0.05). ns stands for the non-significance.
