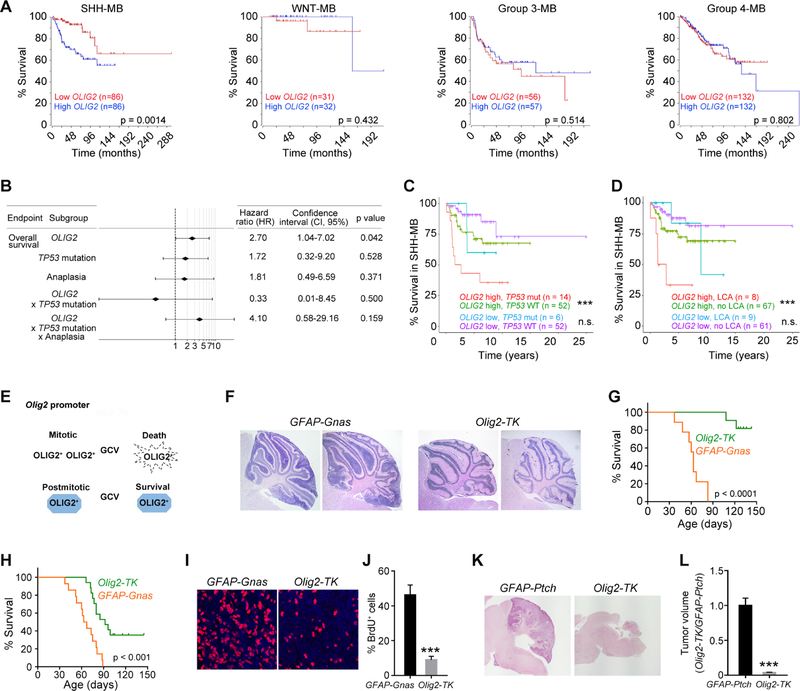
Figure 3. High OLIG2 Signature Predicts Poor Outcome in SHH-MB Patients and Ablation of OLIG2+ Cells Reduces Tumor Growth in Mice.
(A) Kaplan-Meier survival curves of the patients in different MB subgroups based on OLIG2 expression levels.
(B) Cox’s multivariate survival analysis of OLIG2 expression, TP53 mutation status, anaplasia, and their interactions.
(C, D) Overall survival stratified by TP53 mutation (C) or large-cell anaplastic (LCA) (D) with OLIG2 high and low expression in SHH-MB. + indicates censored cases.
(E) Diagram showing GCV-mediated depletion of Olig2-TK+ cells.
(F) H&E-stained cerebellar sections of GFAP-Gnas and Olig2-TK tumors from mice treated with GCV from P5 to P40.
(G, H) Kaplan-Meier survival curves of mice treated with GCV from P5 to P40 (G) or from P15 to P35 (H).
(I) Images of GFAP-Gnas and Olig2-TK tumors at P35 stained for BrdU and DAPI.
(J) Percentage of BrdU+ cells in GFAP-Ptch and Olig2-TK tumors at P35 (n=5 animals/group).
(K) H&E-stained images of GFAP-Ptch and GFAP-Ptch;Olig2-TK tumors of mice treated with GCV from P5 to P10 and harvested at P18.
(L) Relative volumes of GFAP-Ptch and GFAP-Ptch;Olig2-TK tumors (n=5).
Data are means ± SEM; n.s., not significant, ***p<0.001; Student’s t test in J, L; log-rank test in A, C, D, G, H. Scale bars in F, L, 300 µm; in I, 20 µm.
See also Figures S5.

