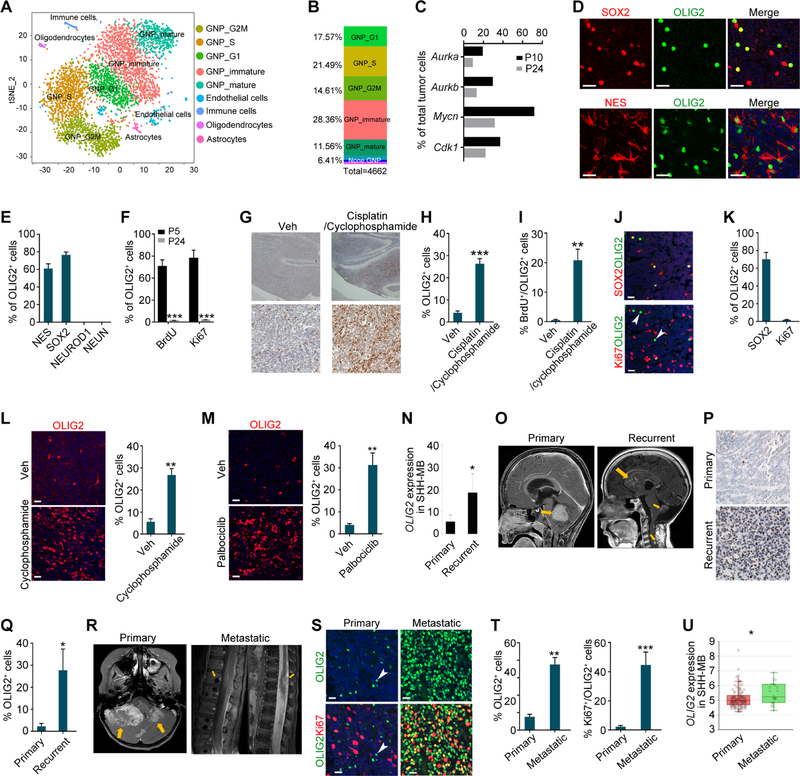
Figure 4. OLIG2+ Quiescent Stem Cells in Late-stage MB are Reactivated during Relapse.
(A) t-SNE plot of cell clusters from GFAP-Ptch MB at P24.
(B) Relative proportions of distinct clusters.
(C) Percentages of cells from GFAP-Ptch tumors expressing indicated genes at P10 and P24.
(D) Images of GFAP-Ptch MB tumors at P24 stained for NES, SOX2, and OLIG2. Arrows, co-labeled cells.
(E, F) Percentages of OLIG2+ cells in indicated GFAP-Ptch MB populations at P24 (E) and at P5 and P24 (F).
(G) Images of OLIG2 immunostained vehicle- and drug-treated Atoh1-Ptch tumors. Veh, Vehicle.
(H, I) Percentages of OLIG2+ (H) and BrdU+/OLIG2+ (I) cells in vehicle- and drug-treated Atoh1-Ptch tumors.
(J, K) MB patient tumors stained for OLIG2, Ki67, and SOX2 (J) and percentages of labeling cells among OLIG2+ cells (K). Arrowheads, OLIG2+ cells; arrows, co-labeled cells.
(L, M) Images of OLIG2 immunostaining (left) and the percentage of OLIG2+ cells (right) in the tumors of vehicle- and cyclophosphamide-treated TB13–5634 cells derived PDX mice (L) and palbociclib-treated Med-314FH cells derived PDX mice (M).
(N) OLIG2 mRNA expression in samples from primary and recurrent SHH-MBs from a publicly available patient cohort (n=5 matched pairs, permutation test).
(O) MRI images of paired primary (left) and recurrent (right) MB from the same patient. Arrows, tumors.
(P) Images of primary (upper) and recurrent (bottom) MB tumors stained for OLIG2.
(Q) The percentage of OLIG2+ cells in primary and recurrent MB tumors.
(R) MRI images of a MB patient with primary (left) and spinal cord metastasis (right) of MB tumors (arrows).
(S) Images of primary (left) and metastatic (right) MB tumors stained for OLIG2 and Ki67. Arrowheads, OLIG2+ cells; arrows, co-labeled cells.
(T) The percentage of OLIG2+ cells among tumor cells (left) or Ki67+ cells among OLIG2+ cells (right) in primary and metastatic patient MB sections.
(U) Box plot of OLIG2 mRNA expression in primary (n=134) and in metastatic (n=26) human SHH-MBs. Whiskers show the minimum and maximum, and boxes extend from the first to the third quartiles with midlines at the medians.
Data are means ± SEM from at least 3 independent experiments; *p<0.05; **p<0.01; ***p<0.001; Student’s t test in F, H, I, L, M, Q, T, U. Scale bars in D, J, L, M, S, 20 µm; in G, P, 100 µm.
See also Figures S6 and S7.

