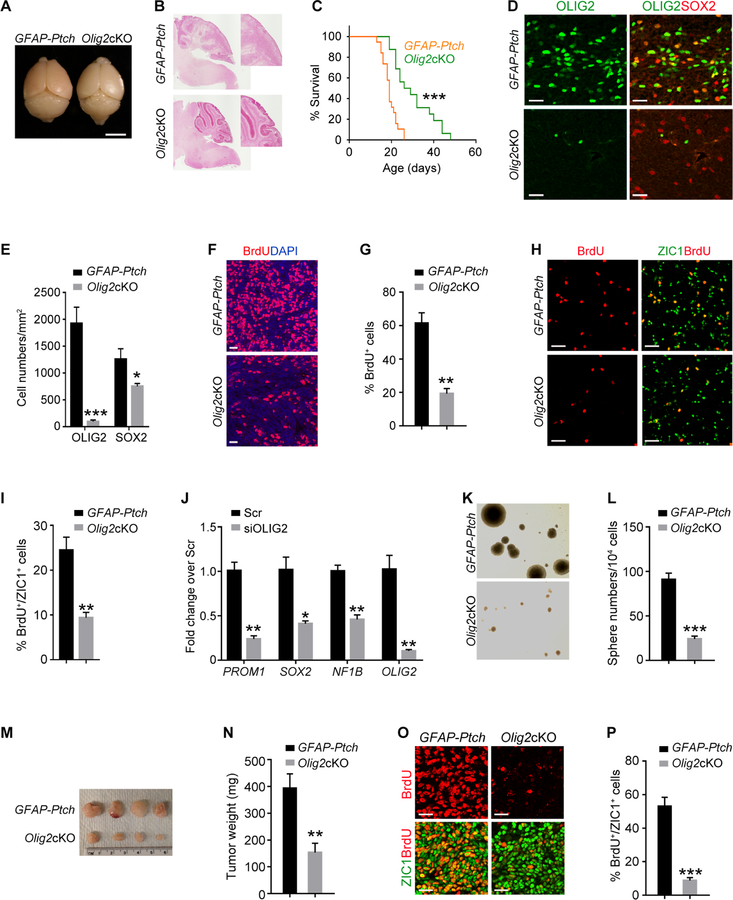
Figure 5. Olig2 Deletion Inhibits Growth of Mouse MB.
(A) Photographs of GFAP-Ptch and Olig2cKO brains at P24. Arrows, cerebellum.
(B) H&E stain of GFAP-Ptch and Olig2cKO tumors at P24. Boxed area is shown at a high magnification.
(C) Kaplan-Meier survival of GFAP-Ptch (n=19) and Olig2cKO (n=16) mice.
(D,E) OLIG2 and SOX2 immunostain (D) and quantification (E) in GFAP-Ptch and Olig2cKO brains at P24.
(F,G) BrdU labeling (F) and the percentage of BrdU+ cells (G) of GFAP-Ptch and Olig2cKO tumors at P24.
(H,I) Immunostaining for BrdU and ZIC1 (H) and the percentage of BrdU+ cells among ZIC1+ GNPs (I) from GFAP-Ptch tumors and Olig2cKO tumors at P24.
(J) qRT-PCR analyses of indicated genes in scrambled control siRNA (Scr) or siOLIG2-treated Daoy cells.
(K, L) Neurosphere formation (K) and sphere numbers per 104 GNPs (L) from GFAP-Ptch and Olig2cKO tumor cells.
(M, N) GFAP-Ptch and Olig2cKO tumor appearance (M) and weight (N) from NSG mice.
(O, P) BrdU and ZIC1 immunostain (O) and the percentage of BrdU+/ZIC1+ cells (P) in tumor sections from NSG mice subcutaneously transplanted with GFAP-Ptch or Olig2cKO tumor cells
Data are means ± SEM from at least 3 independent experiments. *p<0.05, **p<0.01, ***p<0.001; log-rank test in C, Student’s t test in panels E, G, I, J, L, N, P. Scale bars in A, 5 mm; in B, 300 µm; in D, F, H, O, 20 µm; in K, 100 µm.

