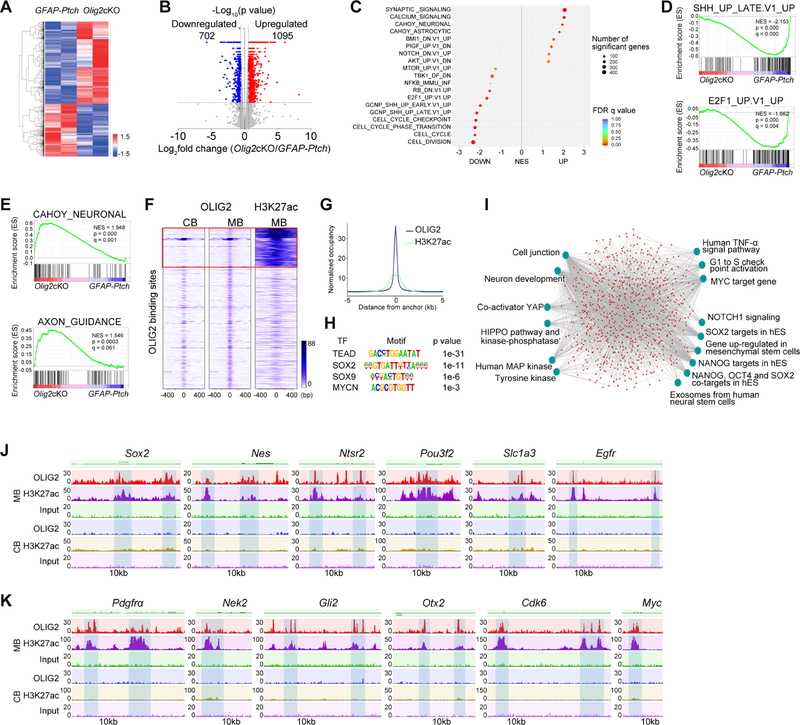
Figure 6. OLIG2 Controls a Network that Regulates Tumor Cell Proliferation and Stemness.
(A) Heatmap of differentially expressed genes in Olig2cKO vs. GFAP-Ptch tumors.
(B) Volcano plot of significantly altered genes (p<0.05).
(C) GSEA analysis of top differentially regulated genes.
(D) GSEA plots of downregulated SHH and E2F1 pathway gene sets in Olig2cKO vs. GFAP-Ptch tumors.
(E) GSEA plots of neuronal signaling and axon guidance gene sets in Olig2cKO vs. GFAP-Ptch tumors.
(F) Heatmaps of OLIG2 and H3K27ac ChIP-seq signals in normal cerebellum (CB) and MB tumors. Box: MB-specific target sites.
(G) H3K27Ac ChIP-seq enrichment profiles around OLIG2-bound regions in M tumors.
(H) The most significantly enriched motifs in OLIG2-bound regions in MB tumors.
(I) ToppGene analysis of OLIG2 and H3K27ac co-targeted pathways in MB tumors. hES, human embryonic stem cells.
(J) OLIG2 and H3K27ac occupancy on genes associated with stemness.
(K) OLIG2 and H3K27ac occupancy on genes associated with cell proliferation and on proto-oncogenes.
See also Figure S8.

