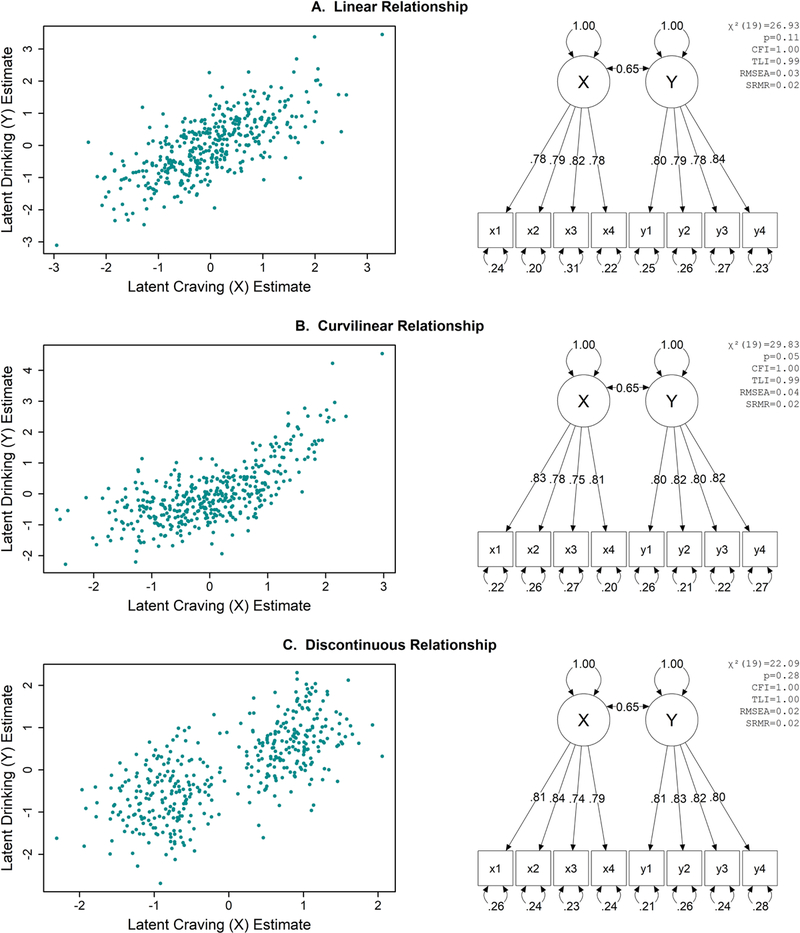
Figure 2. Three different factor score patterns are illustrated via scatterplots (left column) despite having similar model fit indices, path coefficients, and latent variable correlation estimates (right column).

[Color imagine online only] Caption: Data are simulated for this example. All path coefficients are statistically significant. CFI=comparative fit index, TLI=Tucker-Lewis Index, RMSEA=root mean square error of approximation, SRMR=standardized root mean residual.
