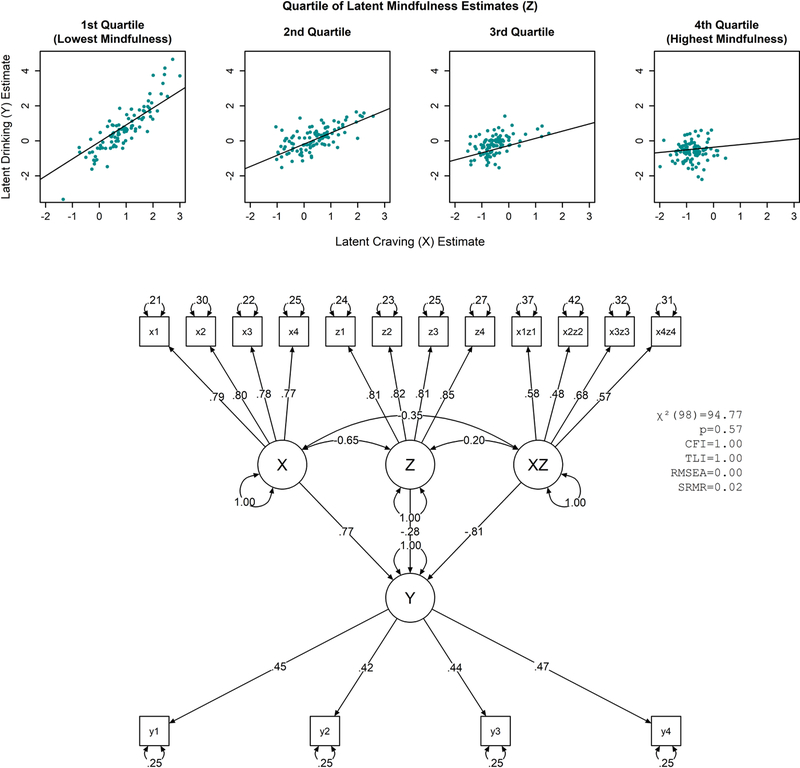
Figure 3. Latent variable moderation analysis visualized using small multiples of scatter plots. [Color imagine online only].

Caption: Scatter plots (top) show latent estimates of X and Y graphed across quartiles of moderator variable Z. The corresponding path diagram is also shown (bottom). Data are simulated for this example. All path coefficients are statistically significant (see supplemental R syntax). See Figure 2 caption for explanation of model fit statistic abbreviations.
