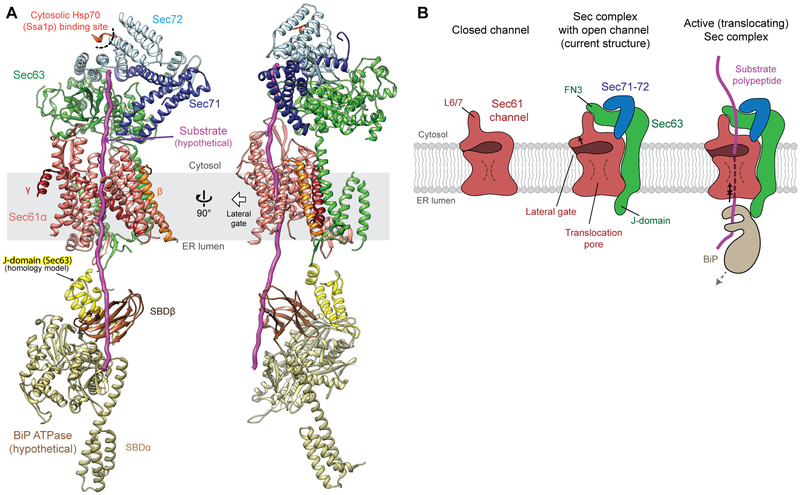
Figure 4. Model of an active translocation complex.
(A) The Sec complex structure superimposed with a Ssa1p C-terminal peptide (red orange; PDB ID: 5L0Y) and DnaK Hsp70 as a model for BiP (yellow and brown; PDB ID: 5RNO). (B) Schematics for a closed Sec61 channel in isolation (left), an open channel in association with Sec63 (middle), and an active Sec complex engaged with a substrate (right; corresponding to the model in (A)). For the full translocation cycle, see fig S8.

