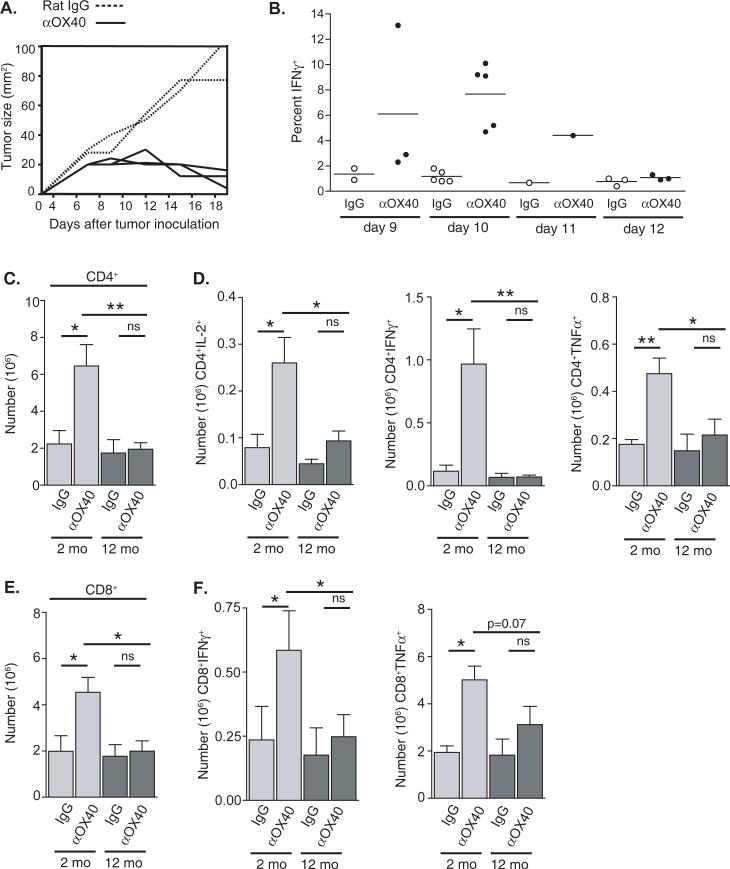
FIGURE 3.
Age-related differences in the numbers of CD4 and CD8 T cells in the tumor draining lymph nodes of anti-OX40 and rat IgG treated tumor-bearing mice ten days after MCA205 tumor challenge. Two- and 12-month old mice were challenged with 1 × 10⁶ MCA205 s.c. and then treated i.p. with 250 μg anti-OX40 or rat IgG. A. After tumor challenge two-month old mice were measured over time for tumor growth. Each curve represents an individual animal. B. Tumor-draining lymph nodes from two-month old tumor-bearing mice were harvested on various days after tumor challenge. Cells from the tumor draining lymph nodes of anti-OX40-treated mice (closed circles) or rat IgG-treated mice (open circles) were restimulated with anti-CD3 (1 μg/mL) for six hours and CD8 T cells were analyzed for intracellular IFNγ production. Each circle represents one animal. C-F. Tumor draining lymph nodes were harvested ten days after tumor challenge and CD4 C. and CD8 E. T cells enumerated. T cells were then restimulated with anti-CD3 for six hours and analyzed for cytokine production via intracellular cytokine staining. D. Number of CD4 T cell producing IL-2, IFNγ, and TNFα F. Number of CD8 T cell producing of IFNγ and TNFα.

