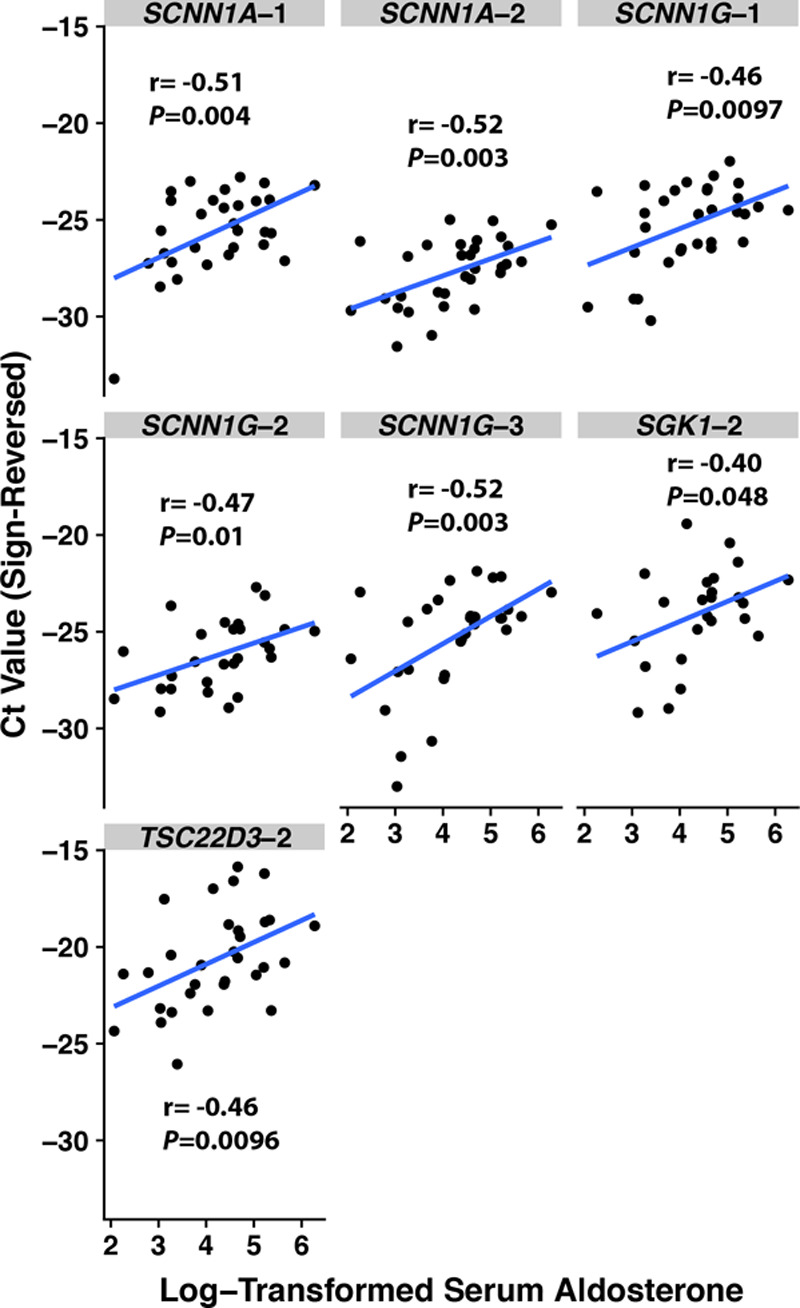
Figure 2.

Scatterplots of cycle threshold (Ct) values according to log-transformed serum aldosterone, with Pearson correlation coefficients. The Ct values’ sign has been reversed (from positive to negative) so that a larger Ct value corresponds with greater gene expression for more intuitive interpretation.
