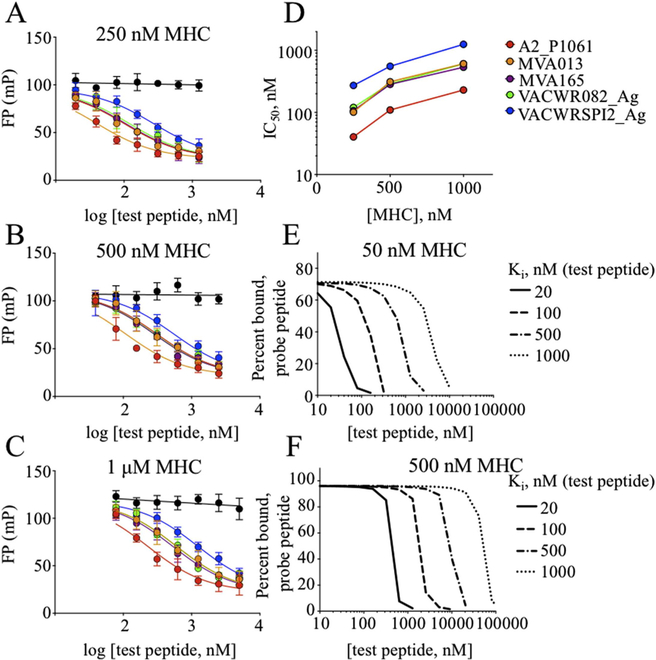
Fig. 6. Dependence of IC50 on MHC concentration.
(A–D) An inhibition assay to determine IC50 values was performed with different MHC concentrations and 25 nM Alexa488-RT(cys), with 2-fold dilutions of competitor peptides beginning at 5 μM (1 μM MHC), 2.5 μM (500 nM MHC), and 1.25 μM (250 nM MHC). As MHC concentration doubles from (A) 250 nM to (B) 500 nM to (C) 1 μM, IC50 values approximately double (D) for the vaccinia peptides tested (shown in Table 2.) Curves were fit using Eq. (5). (E–F) Simulated competition binding curves, calculated using Eq. (8), for 25 nM test peptide with Kd = 20 nM and other parameters as shown.

