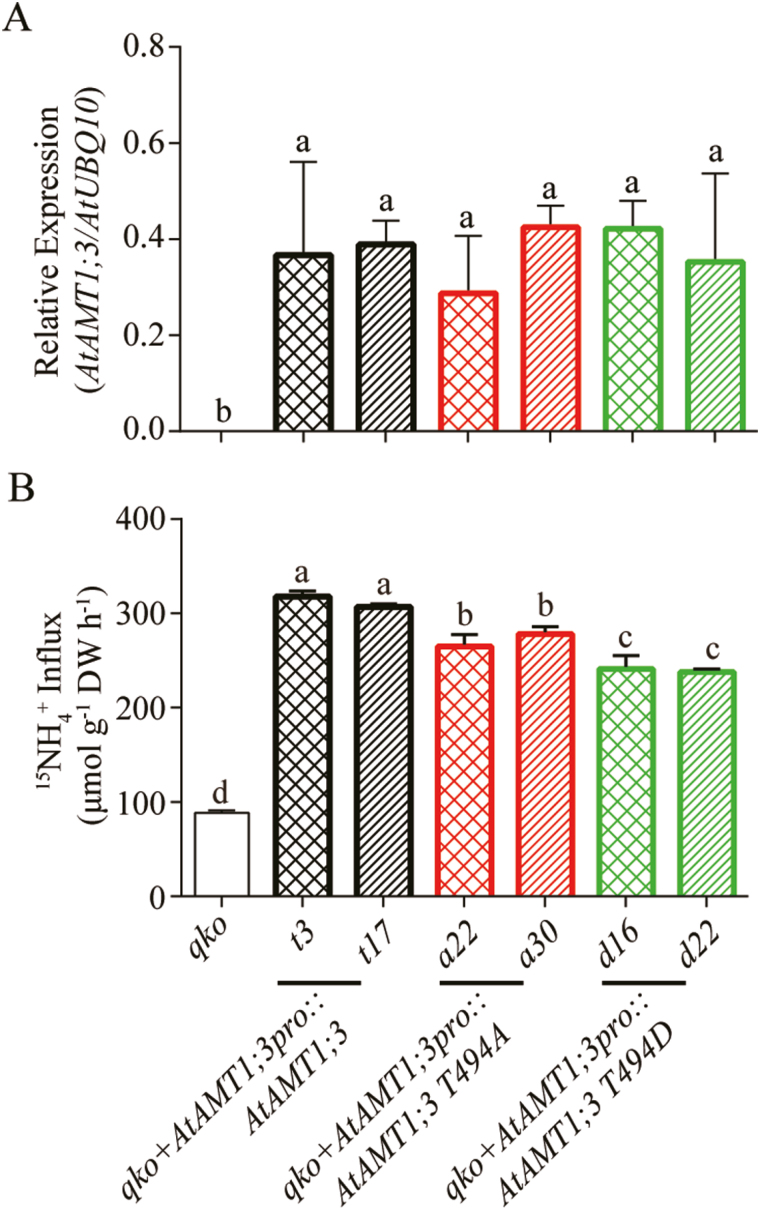
Fig. 4.
Functional characterization of AtAMT1;3 T494 phospho-mutants in transgenic Arabidopsis roots. (A) Transcript expression levels of AtAMT1;3 in roots of qko, qko+AtAMT1;3pro::AtAMT1;3, qko+AtAMT1;3pro::AtAMT1;3 T494A or qko+AtAMT1;3pro::AtAMT1;3 T494D transgenic lines. Levels were quantified by qPCR with three replicates and normalized by AtUBQ10 expression. (B) Influx of 15N-labeled ammonium into roots of the same line as in (A). N-deficient roots were employed for 15N-labeled ammonium influx assays as determined at the concentration of 250 μM. Bars indicate means ±SD (n≥5) and significant differences at P<0.001 according to Tukey’s test are indicated by different letters. (This figure is available in color at JXB online.)

