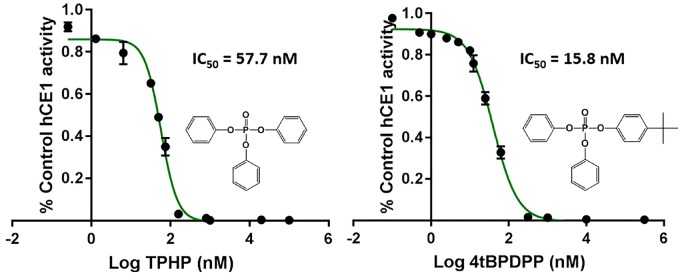
Figure 3.
Inhibition curves for triphenyl phosphate (TPHP) and 4-tert-butylphenyl diphenyl phosphate (4tBPDPP) using 10 µM imidapril and 160 µg/ml human hepatic carboxylesterase (hCE1b). Activity was normalized to control and was determined by measuring imidaprilat formation following 150-min incubations. Experiments were run in duplicate and each point depicts mean ± SEM. IC50 values were calculated using a 3 parameter linear model in JMP Pro 11 (Roberts et al., 2015). More information regarding the model equation can be found in the Supplementary Material.

