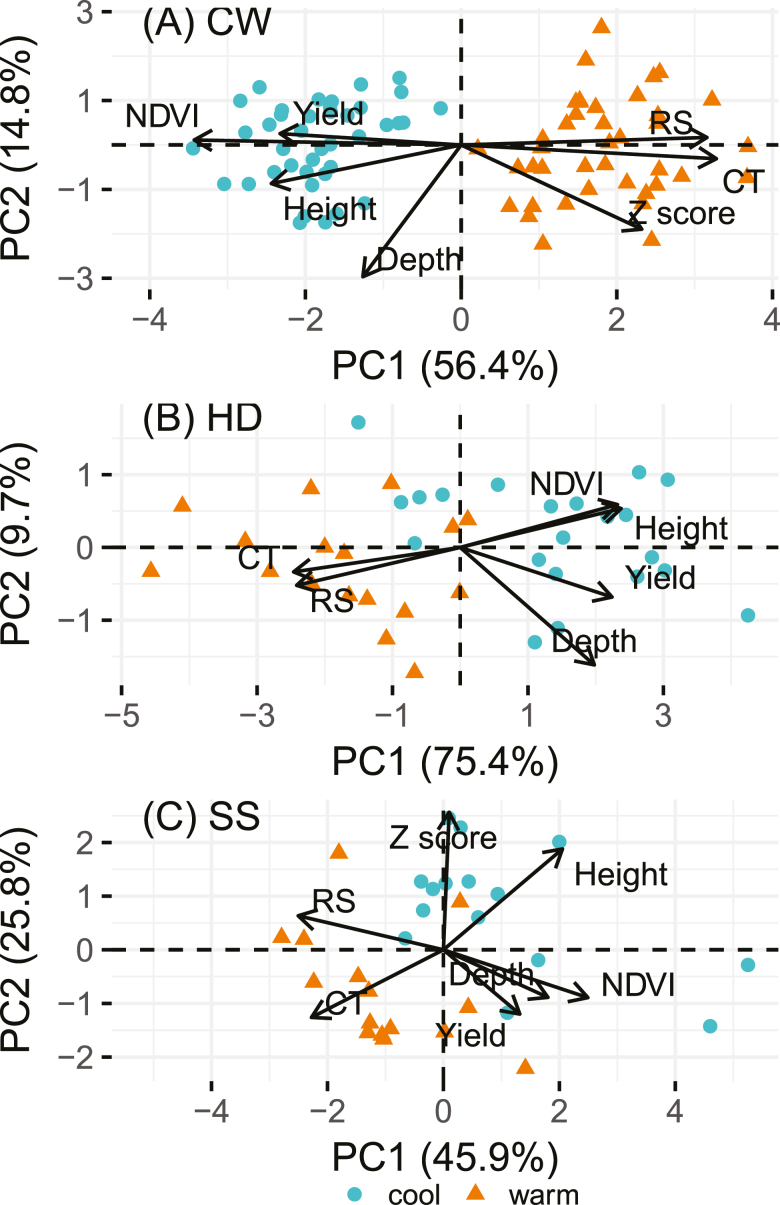
Fig. 4.
Biplots showing the principal component analysis of rooting depth and selected above-ground traits in the CW (A), HD (B), and SS populations (C). Selected traits are as per Table 2. Data from individual plots were used for CW, and means of replicated plots for HD and SS. This figure is available in colour at JXB online.)

