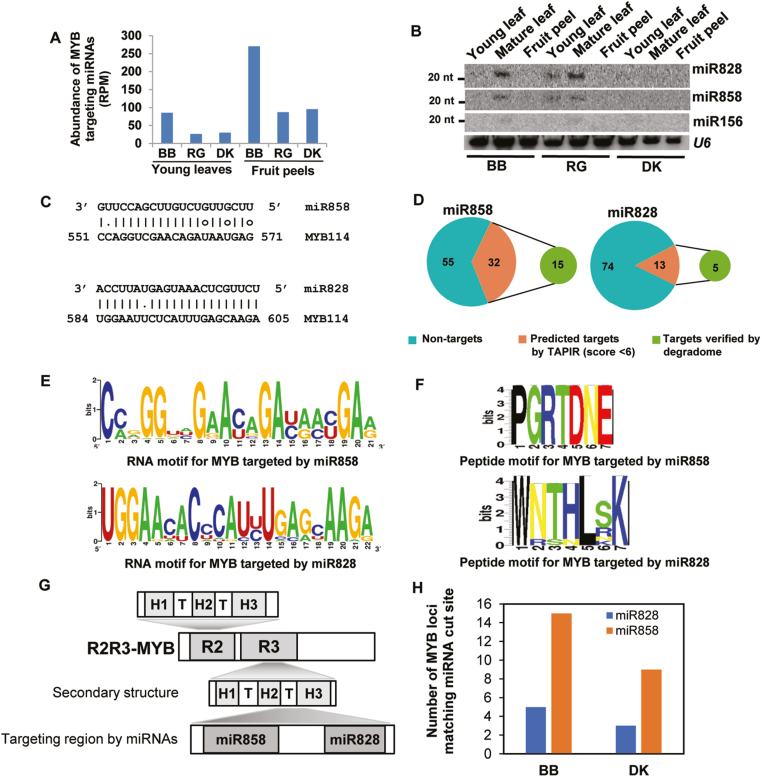
Fig. 2.
MYB targeting miRNAs accumulate in grape varieties with high anthocyanin levels. (A) Bar graph showing the combined expression of miR828 and miR858 among grape lines. RPM values are averages of replicates. (B) Northern blot analysis confirming the accumulation of MYB targeting miRNAs in grapes tissues. U6 was used as a loading control. The 20 nt position of the marker is indicated. (C) Alignment of MYB-targeting miRNAs, miR828 and miR858, with a representative MYB mRNA. Analysis was performed using TAPIR. (D) MYB-targeting abilities of miR828 and miR858 represented as pie charts. Numbers indicate the R2R3 MYB sequences considered for the analysis. (E) Conserved RNA and (F) peptide motifs of MYBs targeted by miR858 and miR828, respectively. (G) Schematic diagram of the MYB domains targeted by miRNAs. H1–3 are helices. (H) Bar graph showing the number of MYB loci whose cleavage was confirmed by degradome analysis.

