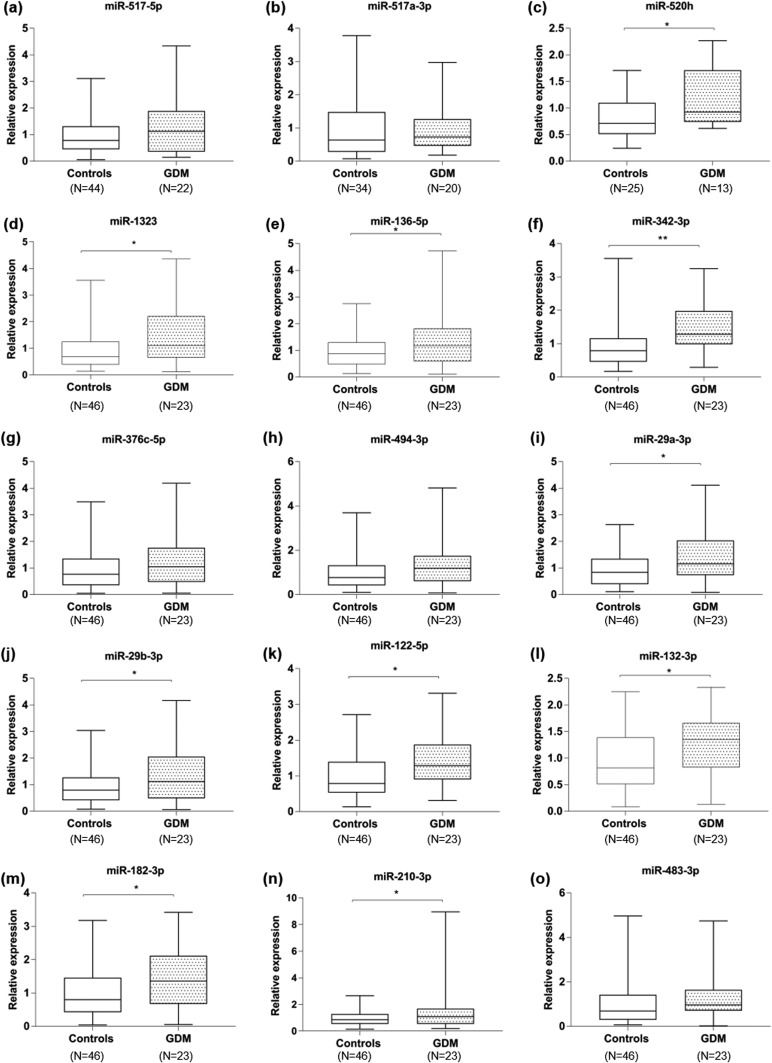
Figure 3.
Boxplots of different levels of EV-miRNAs in pregnancies with GDM compared with normal pregnancies. (a‒o) Relative quantification for each miRNA is indicated for both normal pregnancies (controls) and pregnancies complicated by GDM. (a‒d) miRNAs from C19MC, (e‒h) miRNAs of C14MC, and (i‒o) miRNAs not specific to the placenta. The upper and lower limits of the boxes represent the 75th and 25th percentiles, respectively. The upper and lower whiskers represent the maximum and minimum values. *P ≤ 0.05; **P ≤ 0.01.

