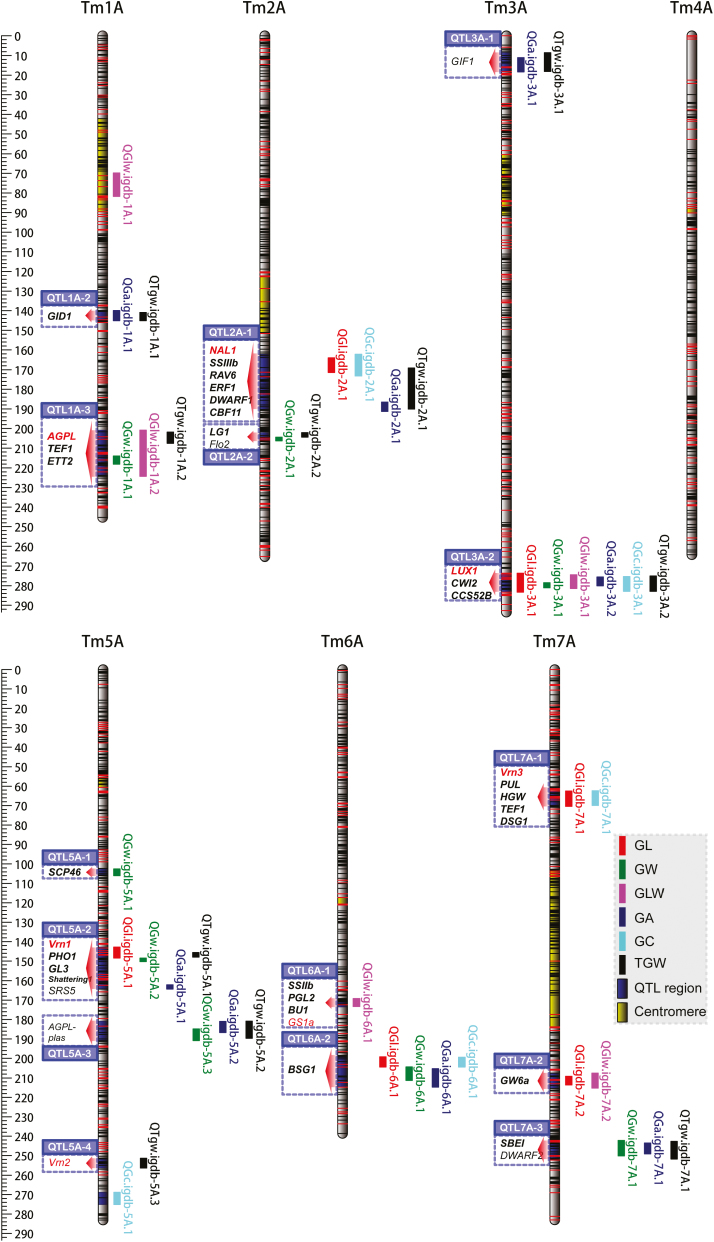
Fig. 2.
QTLs detected genome-wide using the high-density genetic map of einkorn wheat. The genetic map showed 17 genomic regions harboring QTLs for six grain traits in an einkorn wheat RIL population of T. monococcum ssp. boeoticum (KT1-1) and T. monococcum ssp. monococcum (KT3-5). The detected QTLs for each trait from each environment were combined with confidence intervals and mapped on the genetic map. At each linkage group, each QTL is plotted on the right side, while the candidate genes in each QTL region are indicated on the left side. Detailed information on the QTLs is provided in Table 2. The candidate genes of each QTL region are shaded blue, and the red arrows show the QTL regions. Genes in red text were mapped through developing functional markers and genetic mapping, while black bold text denotes genes located inside the QTL region, and red or black normal text denotes genes surrounding the QTL region. The yellow shaded portions of each linkage group are the probable centromere regions. The positions of SNPs and other types of markers are denoted with black and red horizontal lines, respectively. GL, grain length; GW, grain width; GLW, grain length/width; GA, grain area; GC, grain circumference; TGW, thousand-grain weight.

