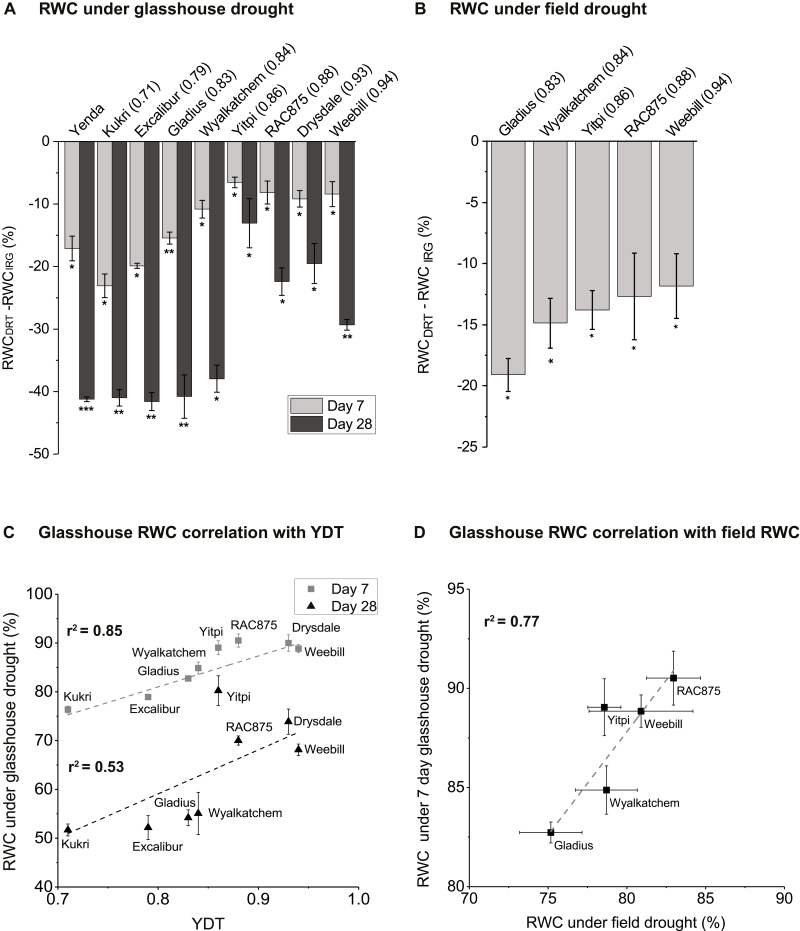
Fig. 2.
Flag leaf relative water content (RWC), its correlation with YDT and between glasshouse and field drought conditions. (A) RWC in all the wheat cultivars under early (day 7) and late (day 28) glasshouse drought relative to the irrigated conditions [RWC (DRT– IRG)]. (B) RWC under rainfed (field drought) relative to the irrigated field conditions. (C) Correlation of RWC under glasshouse drought with field-based YDT. (D) Correlation of RWC between 7 d glasshouse drought and field drought conditions. Error bars represent ±SE (n=3). Asterisks represent statistically significant differences from the respective irrigated control at *P<0.05, **P<0.01, and ***P<0.001. YDT values are shown in parentheses next to the cultivar, except for Yenda which was used as a drought-susceptible control line. The line of the best fit (not taking errors into account) is displayed as a dashed line. DRT and IRG represent drought and irrigation treatment groups, respectively. YDT, yield gap-based drought tolerance.

