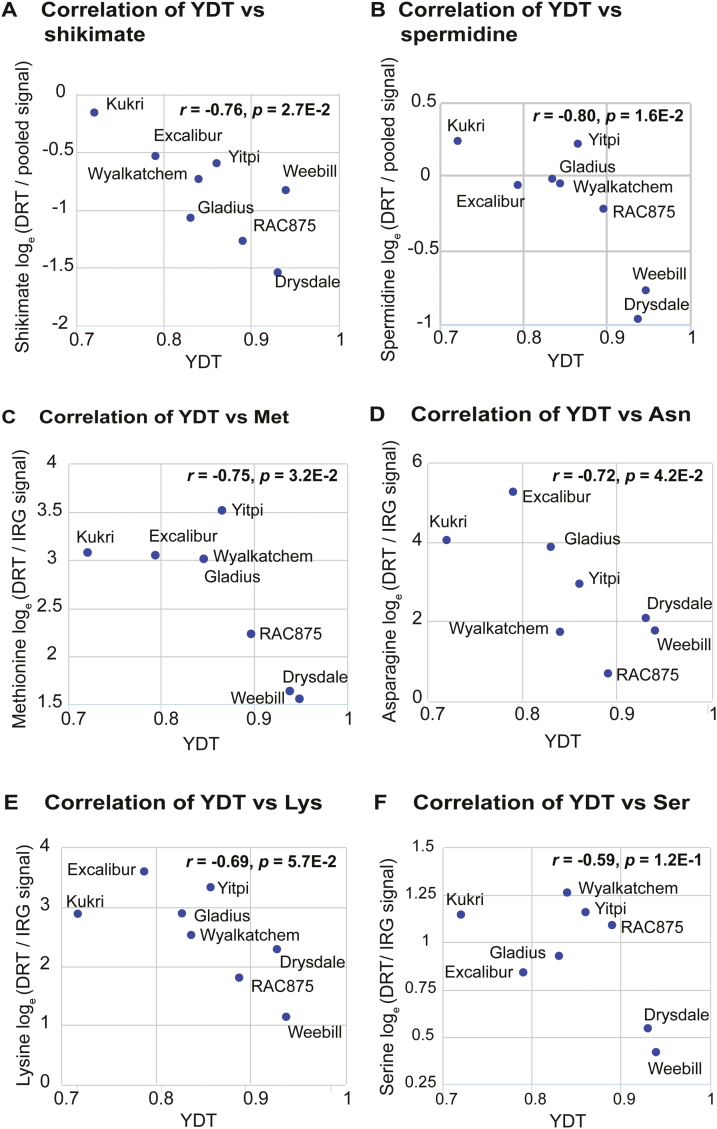
Fig. 5.
Scatter plots for selected metabolite and YDT correlations under the 28 d glasshouse drought treatment. (A and B) Levels of shikimate and spermidine, represented as the natural log-transformed signal intensity ratios between drought-treated (DRT) samples and a universal pooled control extract are plotted against YDT. (C–F) Responses of methionine, asparagine, lysine, and serine represented as natural log-transformed signal intensity ratios of the drought-treated (DRT) to irrigated (IRG) samples are plotted against YDT (yield gap-based drought tolerance) scores. (This figure is available in colour at JXB online.)

