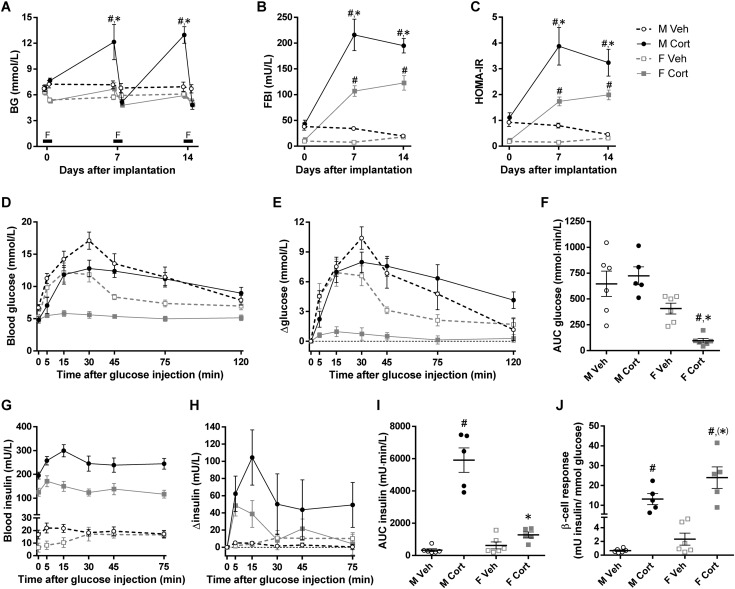
Figure 4.
Sex-dependent effects of corticosterone treatment on glucose clearance. (A) Nonfasting and 5-h FBG levels (NFBG day 7, PS = 0.003, PC = 0.008, PS×C = 0.06; FBG day 7, PS = 0.22, PC = 0.01, PS×C = 0.60; NFBG day 14, PS < 0.001, PC < 0.001, PS×C < 0.001; FBG day 14, PS = 0.08, PC = 0.009, PS×C = 0.07). F indicates the 5-h fasting period on days 0, 7, and 14. (B) Five-hour FBI levels and (C) HOMA-IR calculated from FBG and insulin levels before (day 0) and after (days 7 and 14) pellet implantation (FBI day 7, PS < 0.001, PC < 0.001, PS×C = 0.009; FBI day 14, PS = 0.001, PC < 0.001, PS×C = 0.002; HOMA-IR day 7, PS < 0.001, PC < 0.001, PS×C = 0.04; HOMA-IR day 14, PS = 0.01, PC < 0.001, PS×C = 0.04). (D) Blood glucose levels, (E) changes in blood glucose levels over individual baseline values, (F) baseline-corrected AUCs of glucose levels, (G) blood insulin levels, (H) changes in blood insulin levels over individual baseline values, and (I) baseline-corrected AUCs of insulin levels after IP glucose administration in the 2-wk vehicle- or corticosterone-treated mice are shown (AUC glucose levels, PS < 0.001, PC = 0.16, PS×C = 0.03; AUC insulin levels, PS < 0.001, PC < 0.001, PS×C < 0.001). (J) β-Cell response to the IPGTT (PS = 0.04, PC < 0.001, PS×C = 0.12). Statistical significance was determined by two-way ANOVA. *P < 0.05, (*)P < 0.10 (tendency to significance), for sex difference between mice with the same treatment; #P < 0.05, for effect of corticosterone treatment in mice of the same sex, by post hoc test.

