Figure 1.
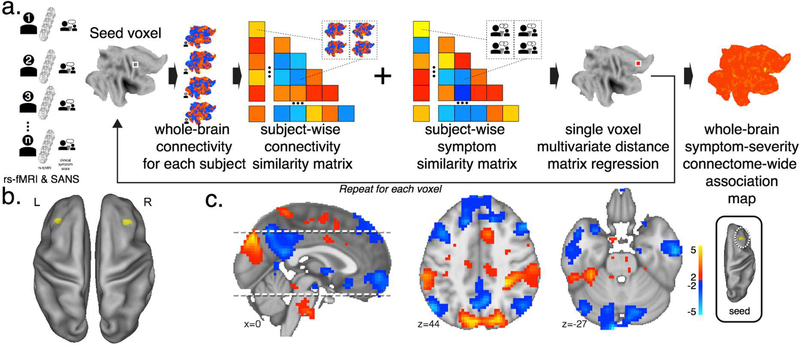
Multivariate distance matrix regression (MDMR) of negative symptoms in schizophrenia. (a) The MDMR method (after Shezad et al.16). Symptom scales and resting state fMRI data is collected from each participant. For each voxel in the brain atlas: the voxel is used as a seed region to create a connectivity map for each participant. Those maps are compared to each other to create a subject-wise similarity matrix. The symptom scale scores for each participant are then combined with the connectivity similarity matrix to produce a pseudo-F statistic which describes the symptom predictor’s ability to describe the similarity of the functional connectivity. A permutation test of the subject labels can be used to test the significance of this pseudo-F statistic. Each MDMR voxel wise result is then combined to produce a map of each voxels’ connectivity pattern’s ability to predict a symptom score. (b) MDMR results for negative symptoms in the network discovery cohort, voxelwise thresholded p<.005, cluster corrected at p<0.05. Bilateral dorso-lateral prefrontal cortex regions are identified. (c) MDMR results demonstrate the locations where the variability in connectivity from that region co-varies with symptom scales. In a post-hoc analysis, a seed-region was placed in the right dorsolateral prefrontal cortex in all subjects and then this seed-based connectivity map was correlated with symptom severity to identify locations where increasing connectivity to dorsolateral prefrontal cortex corresponds to better symptoms (red) and decreased connectivity corresponds to worse symptoms (blue). Thus, regions in blue correspond to locations where connectivity breakdown with dorsolateral prefrontal cortex corresponds to symptom worsening. The strongest dorsolateral prefrontal cortex connectivity breakdown to symptom severity correlation was observed in the midline cerebellum (MNI x-9, y-96, z-27).

