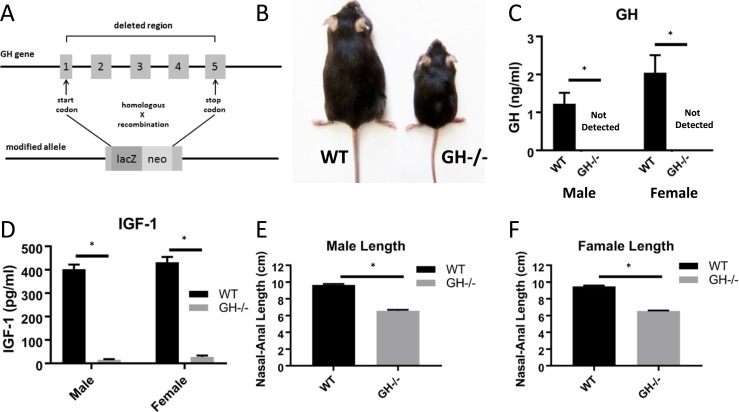
Figure 1.
GH, IGF-1, and body length in GH−/− mice. (A) The entire GH coding sequence from the start to the stop codon was removed, as described in “Methods.” (B) Representative image of a WT littermate control next to a dwarf GH−/− mouse at 6 mo of age. (C, D) Fasting serum GH and IGF-1 levels at age 6 mo (n = 8 to 11). (E) Mean body lengths for males are shown (n = 8 to 11). (F) Mean body lengths for females are shown (n = 8 to 10). Vertical bars represent standard error. *P < 0.05, significantly different from WT controls.

