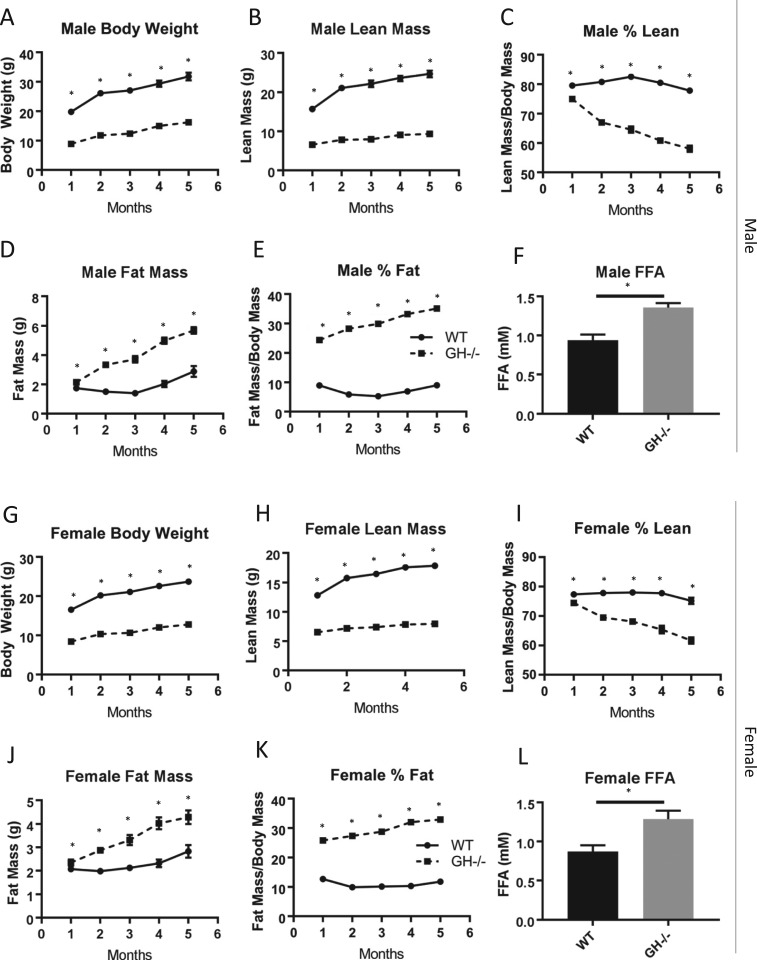
Figure 2.
Body weight and composition in GH−/− mice. (A–F) Body weight, lean mass, percentage of lean mass, fat mass, percentage of fat mass, and 6-mo fasting free fatty acid (FFA) levels in males are shown (n = 8 to 11). (G–L) Body weight, lean mass, percentage of lean mass, fat mass, percentage of fat mass, and 6-mo fasting FFA levels in females are shown (n = 8 to 10). Vertical bars represent standard error. *P < 0.05, significantly different from WT controls.

