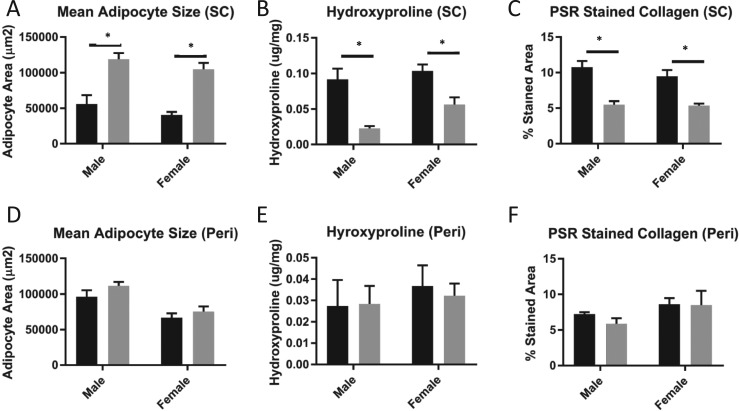
Figure 6.
Adipocyte size and level of fibrosis in subcutaneous (SC) vs perigonadal (Peri) WAT. Mean adipocyte size is shown for (A) SC and (D) Peri WAT depots. Hydroxyproline content is shown for (B) SC WAT and (E) Peri WAT. Percentage of stained PSR tissue area is shown for (C) SC WAT and (F) Peri WAT. Black bars represent control mice; gray bars represent GH−/− mice. All analyses were done on 6-mo-old mice (n = 8 to 11). Vertical bars represent standard error. *P < 0.05, significantly different from WT controls.

