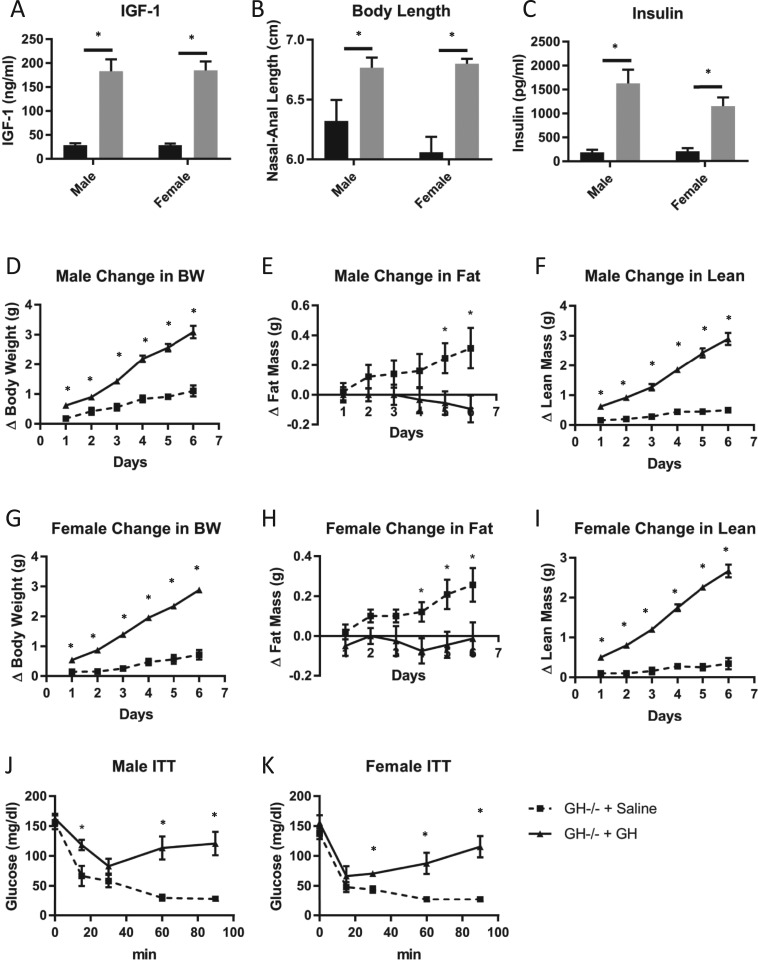
Figure 7.
Effects of GH vs saline treatment in GH−/− mice. Levels of (A) plasma IGF-1, (B) body length, and (C) fasting plasma insulin are shown for both sexes. (A–C) GH−/− control mice receiving saline injections are represented by black bars; GH−/− mice receiving GH are represented by gray bars. Measures of body composition for (D–F) males and (G–I) females are shown and include change in (D, G) body weight (BW), (E, H) fat mass, and (F, I) lean mass. Insulin tolerance of (J) male and (K) female mice is shown. (D–K) Saline-treated GH−/− control mice are represented by square boxes and dashed lines; GH-treated GH−/− mice are represented by circles and solid lines. Vertical bars represent standard error. All analyses were performed on mice from 5 to 6 wk of age (n = 4 to 6). * P < 0.05, significantly different from WT controls.

