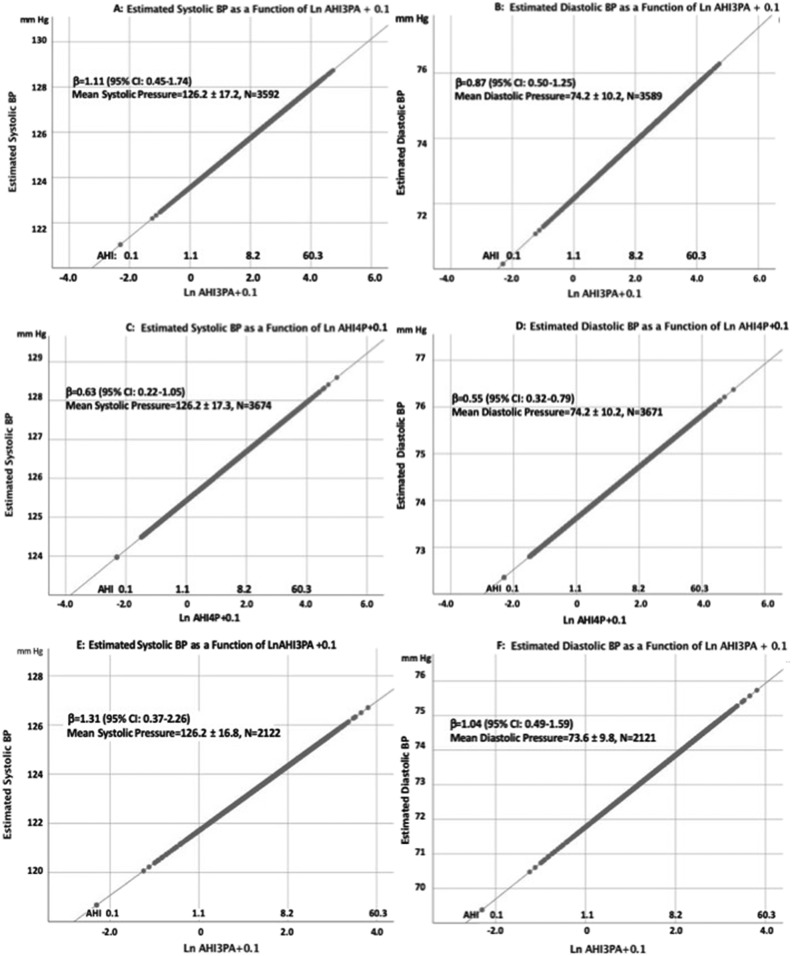
Figure 1. Graphic representations of the association of LnAHI + 0.1 and either systolic or diastolic blood pressure for each of the models shown in Table 6.
Values for BMI, sex, smoking, race/ethnicity and age were fixed at their respective means in order to generate an illustrative 2-dimensional plot. The values for LnAHI + 0.1 were converted to the AHI and shown as an alternative x-axis to facilitate visualization. (A) Estimated systolic blood pressure as a function of Ln AHI defined by a 3% desaturation or arousal for hypopneas. (B) Estimated diastolic blood pressure as a function of Ln AHI defined by a 3% desaturation or arousal for hypopneas. (C) Estimated systolic blood pressure as a function of Ln AHI defined by a 4% desaturation for hypopneas. (D) Estimated diastolic blood pressure as a function of Ln AHI defined by a 4% desaturation for hypopneas. (E) Estimated systolic blood pressure as a function of Ln AHI defined by a 3% desaturation or arousal for hypopneas in participants who had an AHI < 5 events/h using an AHI definition defined by a 4% desaturation for hypopneas. (F) Estimated diastolic blood pressure as a function of Ln AHI defined by a 3% desaturation or arousal for hypopneas in participants who had an AHI < 5 events/h using an AHI definition defined by a 4% desaturation for hypopneas.

