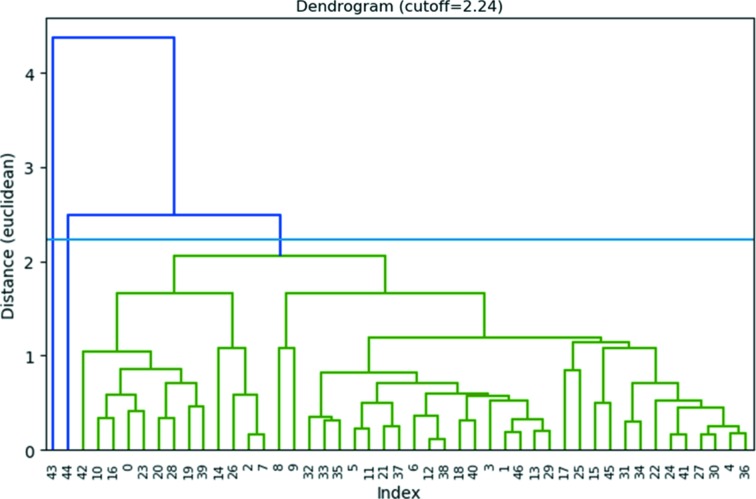
Figure 5.
Dendrogram showing the results of the hierarchical cluster analysis of the lattice parameters of ZSM-5, using the Euclidean distance between the lattice parameters as a metric. The cut distance is represented by the blue line (2.24). Two outliers (No. 43 and No. 44) with deviating lattice parameters were excluded, resulting in a single cluster with 45 items.

