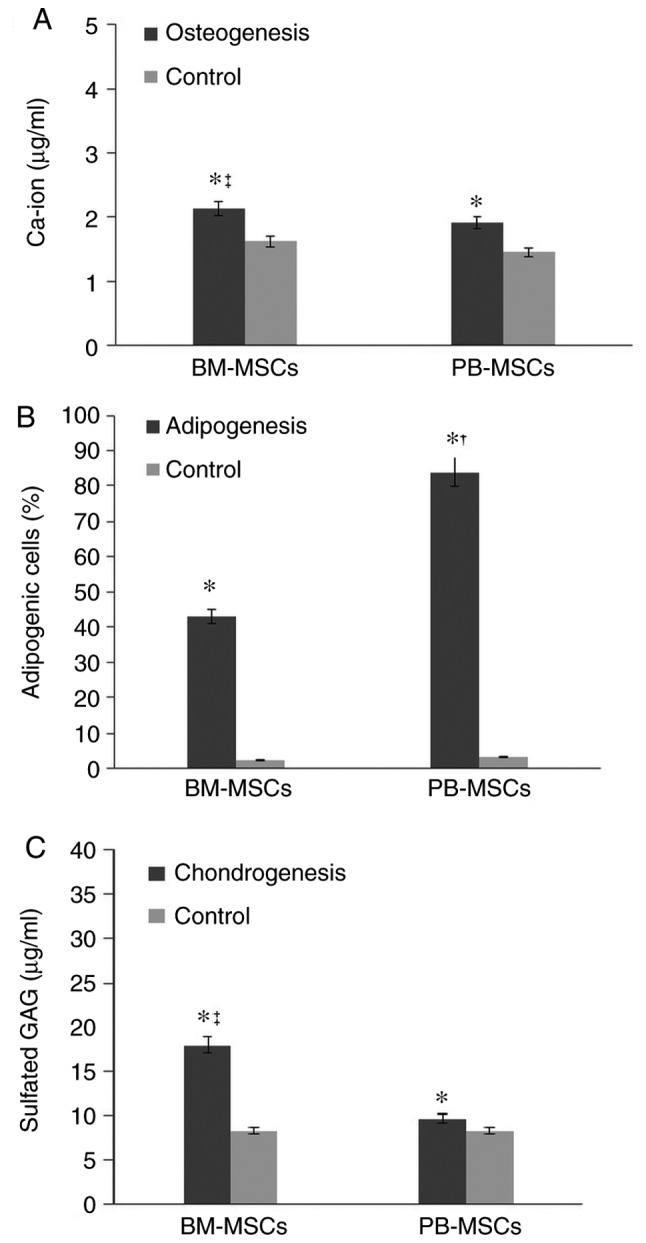
Figure 4.

Quantitative analysis of the differentiation capability of BM-MSCs and PB-MSCs. (A) Osteogenesis detection by Ca-ion assays. (B) The adipogenesis percentage in PB-MSCs and BM-MSCs. (C) Chondro detection by GAG assay. Data are shown as the mean ± standard deviation (n=3). *P<0.05 vs. the control, †P<0.05 vs. BM-MSCs, ‡P<0.05 vs. PB-MSCs. BM-MSCs, bone marrow-mesenchymal stromal cells; PB, peripheral blood; chondro, chondrogenesis.
