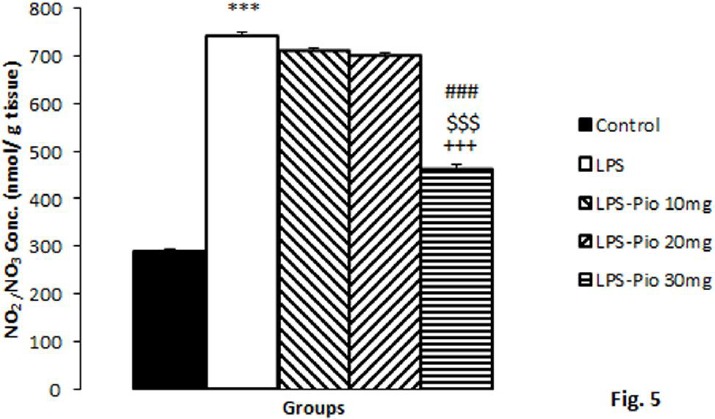
Figure 5.
The NO metabolites in hippocampal tissues among the experimental groups. Data are presented as mean±SEM (n=10 per group). ***P<0.001 in comparison with Control group, +++P<0.001 in comparison with LPS group. $$$P<0.001 comparison of LPS-Pio 30 mg with LPS-Pio 10 mg group and ###P<0.001 comparison of LPS-Pio 30 mg with LPS-Pio 20 mg group

Pio: pioglitazone; LPS: lipopolysaccharide; Ctrl: control
