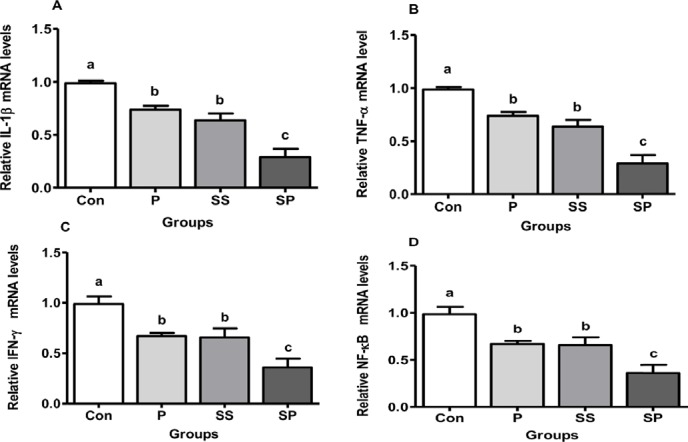
Figure 2. Effect of P, SS, and SP on the relative mRNA levels of liver IL-1β (A), TNF-α (B), IFN-ɣ (C), and NF-кB (D) in broiler chickens, Control (Con), P, SS, and SP. Each bar represents mean of 10 samples in a group and standard error. The values with unlike superscript letters (a, b, c) in the figure represent different levels of significance at p < 0.05.

