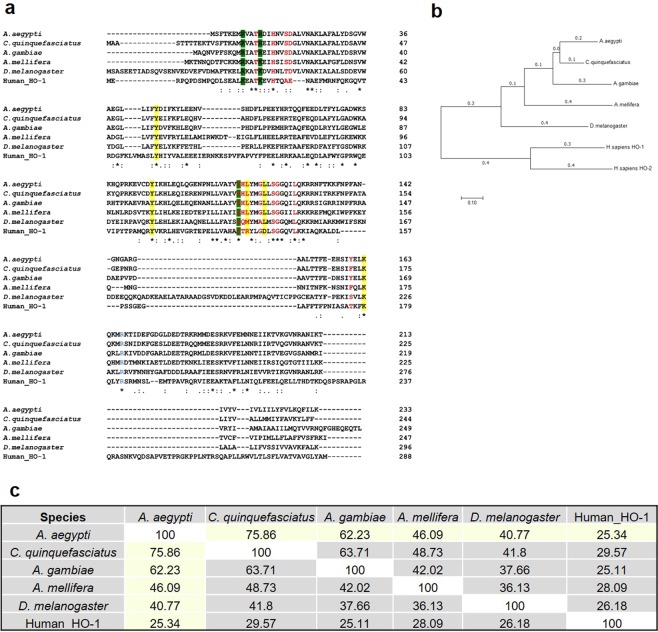
Figure 1.
Heme oxygenase amino acid sequence. (a) Alignment of HOs from several insects and human HO-1, comparing the most important residues in the heme interaction. Residues that contact to heme (red); hydrophobic residues wall (blue); residues that exhibit interaction with propionates (green box) and polar residues clusters (yellow box). (b) Neighbor-Joining phylogenetic tree for insects and human HOs. The optimal tree with the sum of branch length = 3.03131229 is shown. The tree is drawn to scale, with branch lengths (next to the branches) in the same units as those of the evolutionary distances used to infer the phylogenetic tree. The evolutionary distances were computed using the Poisson correction method and are in the units of the number of amino acid substitutions per site. (c) Percent identity matrix based on alignment (Clustal Omega).

