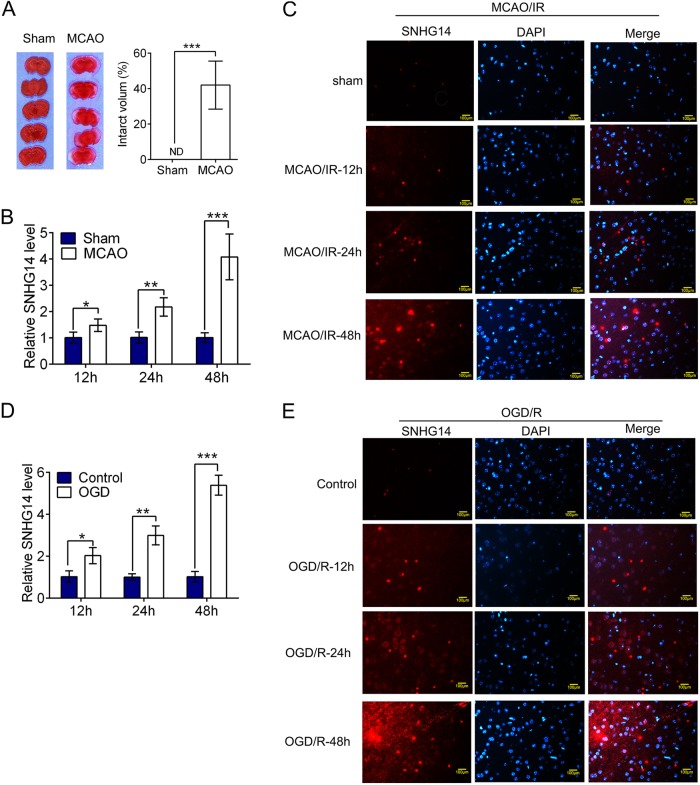
Fig. 1.
SNHG14 was upregulated following I/R in vitro and in vivo. a Representative brain sections of focal ischemia induced by MCAO were exhibited by TTC staining. Quantitative analysis of brain infarct volume after I/R in rats were shown by bar graph. b The expression of SNHG14 level was detected by qRT-PCR at 12, 24, and 48 h following MCAO/R in rats. c Representative images exhibiting the expression level and intracellular localization of SNHG14 were determined by RNA-FISH at 12, 24, and 48 h following MCAO/R in rats. a–c N = 6 per group. d The expression level of SNHG14 was examined by qRT-PCR in PC-12 cells after OGD/R. e Representative images exhibiting the expression level and intracellular localization of SNHG14 were determined by RNA-FISH in PC-12 cells after OGD/R. Data were expressed as mean ± SD. ***P < 0.001 represents statistically difference. Scale bar = 100 μm

