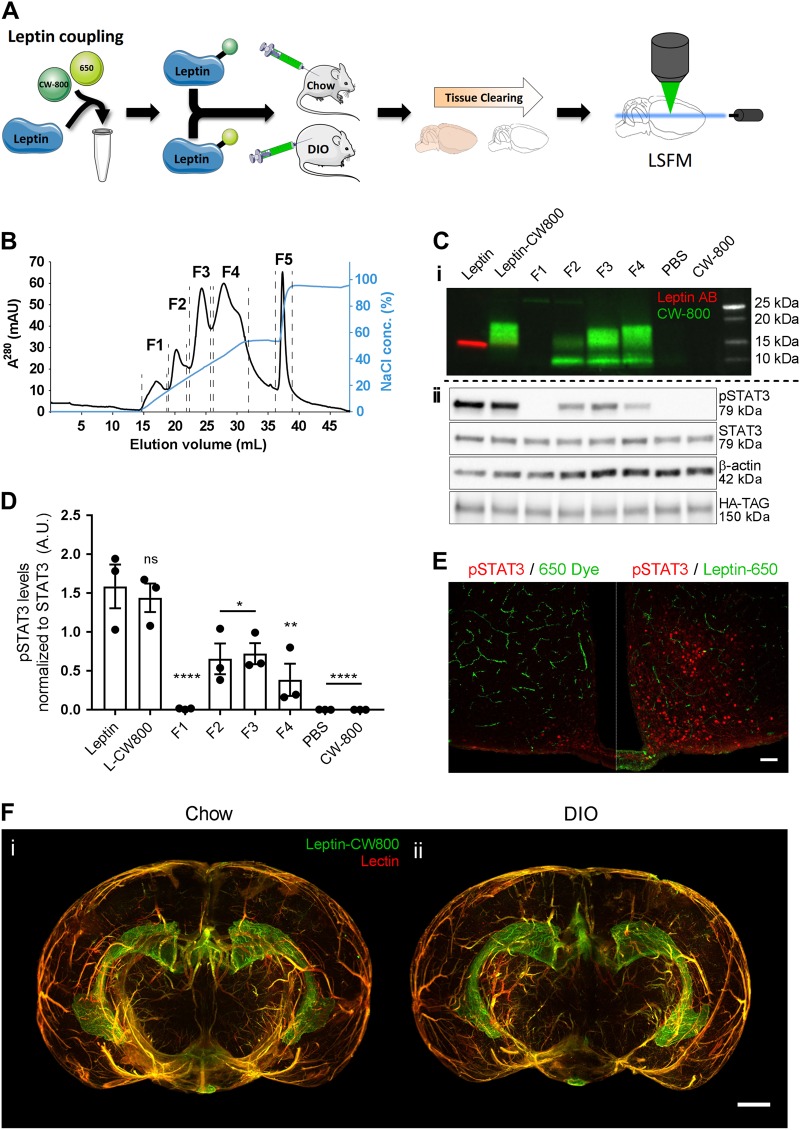
Fig. 1.
Labeled leptin combined with tissue clearing and light-sheet fluorescence microscopy allows for 3D visualization of leptin distribution in the intact mouse brain. a Leptin was coupled to either an infrared fluorescent dye (CW800) or a far-red fluorescent dye (650). Labeled leptin was then injected into chow-fed lean mice or age-matched diet-induced obese (DIO) mice fed with HFD for 20 weeks. Brains were collected 45 min after leptin injections and subjected to tissue clearing followed by LSFM to obtain 3D whole brain images. b Anion exchange chromatography was used to purify CW800 labeled leptin. Individual fractions F1–F4 were collected based on UV absorption (280 nm). A final fraction (F5) was collected by increasing the NaCl concentration above 50%, which is known to remove any remaining bound substances from the column. c-i Leptin, leptin-CW800, fractions F1–F4, PBS and CW800 alone were subjected to SDS-Page and Western blotting. Leptin bands were detected by either immunolabeling with a leptin antibody (red) or infrared fluorescence (green). c-ii Murine LepRb overexpressing HEK293 cells were incubated for 30 min with native leptin, leptin-CW800, fractions F1–F4, CW800 alone, or PBS to measure pSTAT3 levels as a marker for leptin bioactivity. d Densitometric analysis of the pSTAT3 signal from the western blots seen in c-ii . e Bioactivity was further confirmed in vivo by injecting leptin-650 (i.p., 5 mg kg−1) in mice and analyzing pSTAT3 45 min after leptin administration (pSTAT3 shown in red, leptin-650 or the 650 dye alone shown in green). f Mice, either chow-fed and lean (i) or HFD-fed and DIO (ii), were injected with leptin-CW800 (i.p., 5 mg kg−1) and lectin-647 (i.v., 250 µg). 3D-reconstruction of the brains reveals leptin accumulation in the ME and CP (Lectin-647 shown in red, leptin-CW800 shown in green). Scale bars for e and f are 100 and 1000 µm, respectively. Data in D are means ± SEM for 3 independent experiments. Significance was determined using One-Way ANOVA and Bonferonni’s post-hoc testing. Significance is depicted as *p < 0.05, **p < 0.01, ****p < 0.0001

