Fig. 2.
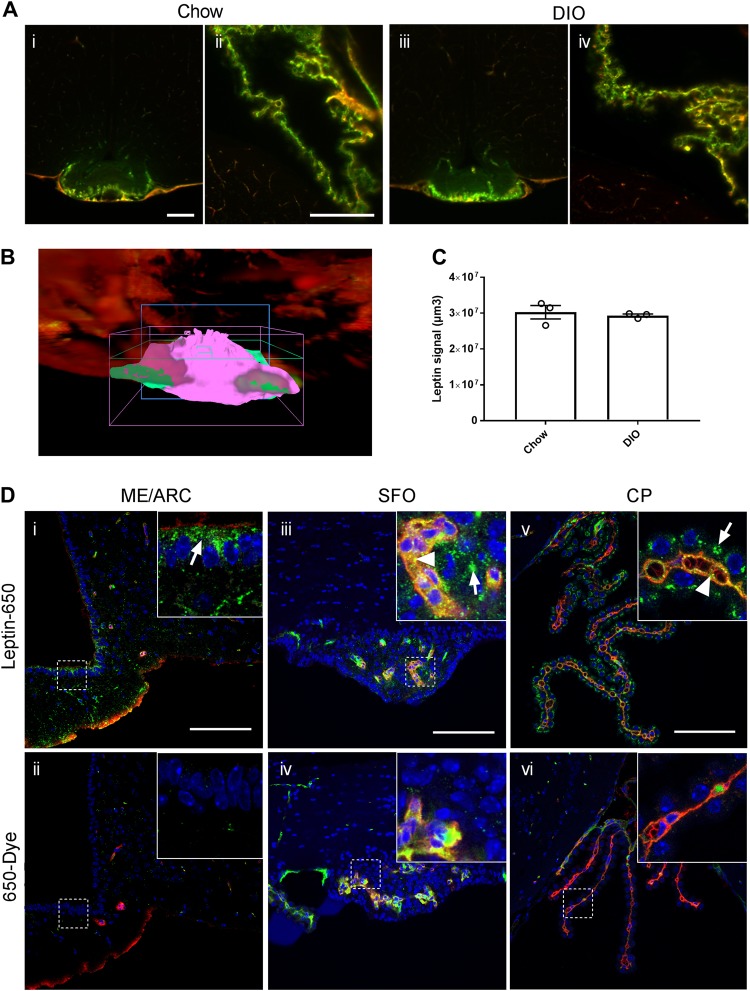
Accumulation of labeled leptin in circumventricular organs and the choroid plexus of mice. a Leptin-CW800 (i.p., 5 mg kg−1) and lectin-647 (i.v., 250 µg) were injected into either DIO or chow control mice, and the brains examined with LSFM. (Leptin-CW800 shown in green, lectin-647 shown in red). Leptin-CW800 that has entered the brain parenchyma is seen as green, whereas leptin-CW800 within the blood vessels is visualized as yellow. a-i and a-iii depict the ME and a-ii and a-iv depict the CP in the lateral ventricle. b Screenshot depicting the leptin volume (pink) and blood vessel volume (turquoise) calculations from the ARIVIS image analysis software package. c Quantification of the total leptin volume within the ME for lean chow fed and DIO mice. d To obtain higher resolution of specific regions, leptin-650 (i.p., 5 mg kg−1) or 650-Dye and lectin-488 (i.v., 250 µg) were injected into chow fed mice and examined via confocal microscopy. Arrows indicate leptin-650 in the brain parenchyma, arrowheads indicate leptin-650 within blood vessels. ME median eminence, ARC arcuate nucleus, SFO subfornical organ, CP choroid plexus (lateral ventricle). Scale bars for a-i and ii are 100 µm, and for di–vi 100 µm. Leptin-CW800/leptin-650 are shown in green, lectin-647/lectin488 are shown in red, DAPI is shown in blue. Data in c are means ± SEM for an n of 3. Significance was determined using a two-tailed student’s t-test

