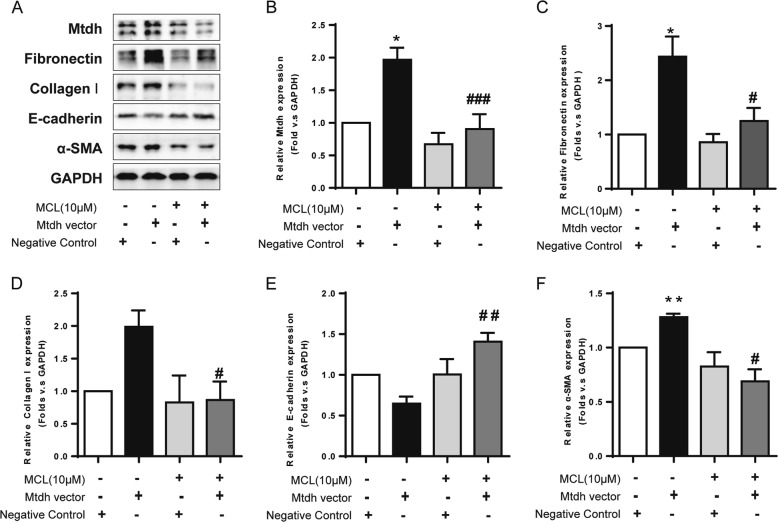
Fig. 8.
MCL Relieves the Fibrotic Phenotype Induced by Mtdh Overexpression. a Representative Western blot analyses of levels of Mtdh and EMT markers. b, c, d, e and f Relative protein expression shown in (a). *P < 0.05 compared with the NC group; **P < 0.01 compared with the NC group; #P < 0.05 compared with the Mtdh vector group; ##P < 0.01 compared with the Mtdh vector group; ###P < 0.001 compared with the Mtdh vector group; #### P < 0.0001 compared with the Mtdh vector group. The data are presented as the mean ± SEM of at least three independent experiments

