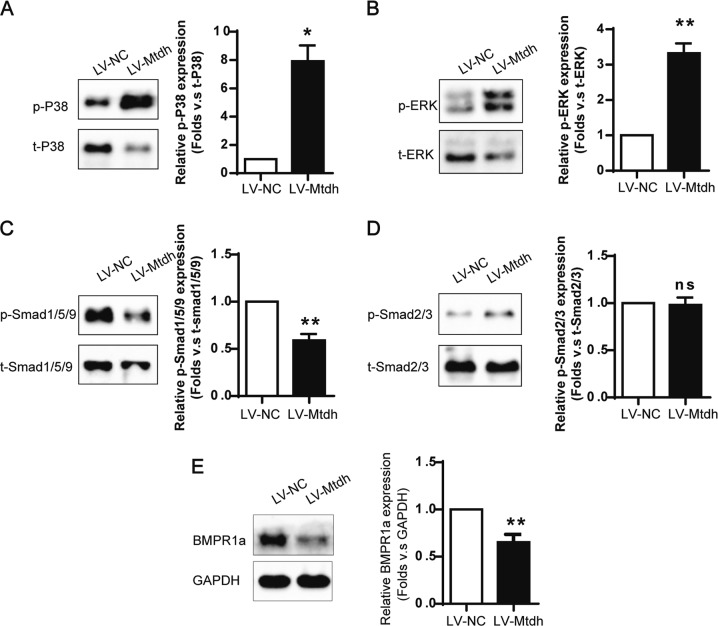
Fig. 9.
Mtdh Activates BMP/MAPK Signalling. a Representative Western blot analyses of phosphorylated P38 MAPK. *P < 0.05 compared with LV-NC. b Representative Western blot analyses of phosphorylated ERK. **P < 0.01 compared withLV-NC. c Representative Western blot analyses of phosphorylated Smad1/5/9. **P < 0.01 compared with LV-NC. d Representative Western blot analyses of phosphorylated Smad2/3. ns indicates P > 0.05 compared with LV-NC. e Representative Western blot analyses of BMPR1A. **P < 0.01 compared with LV-NC. The data are presented as the mean ± SEM of at least three independent experiments

