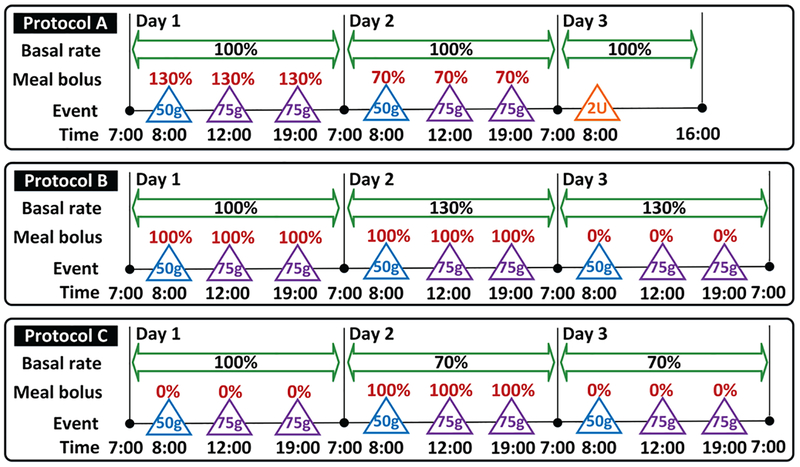
Fig. 3:
List of protocols used for performance evaluation of the proposed controller. The blue and purple triangles denote meals of 50 g and 75 g CHO, respectively. The orange triangle denotes unannounced insulin bolus of 2 units. Basal rate is provided in terms of percentages of the default value. Meal boluses are described in terms of the percentages of the actual meal sizes.

