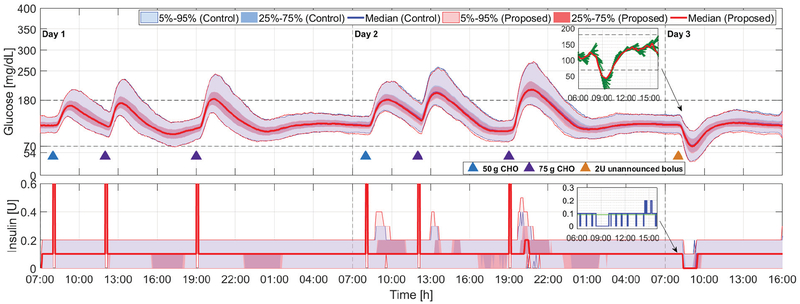
Fig. 4:
Comparison of the proposed method (red curves and light red areas) with the zone-MPC developed in [7] (blue curves and light blue areas) for Protocol A; see Section IV and Fig. 3. Blue and purple triangles denote meals of 50 g and 75 g CHO, respectively, and the orange triangle denotes a 2-unit unannounced insulin bolus. Snapshots of the glucose and insulin profile of a particular in silico subject on Day 3 obtained using the proposed adaptation method are also provided, where in the glucose panel the red curve denotes the CGM readings and the green curves denote the glucose predictions at each sampling instant, in the insulin panel the blue curve denotes insulin delivered at each time instant and the green line denotes basal rate.

