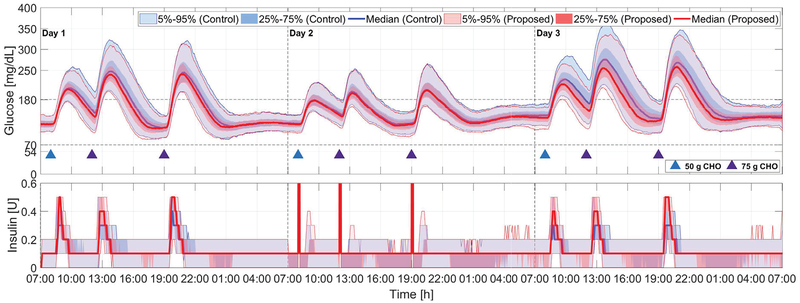
Fig. 6:
Comparison of the proposed method (red curves and light red areas) with the zone-MPC developed in [7] (blue curves and light blue areas) for Protocol C; see Section IV and Fig. 3. Blue and purple triangles denote meals of 50 g and 75 g CHO, respectively.

