
Figure 10.
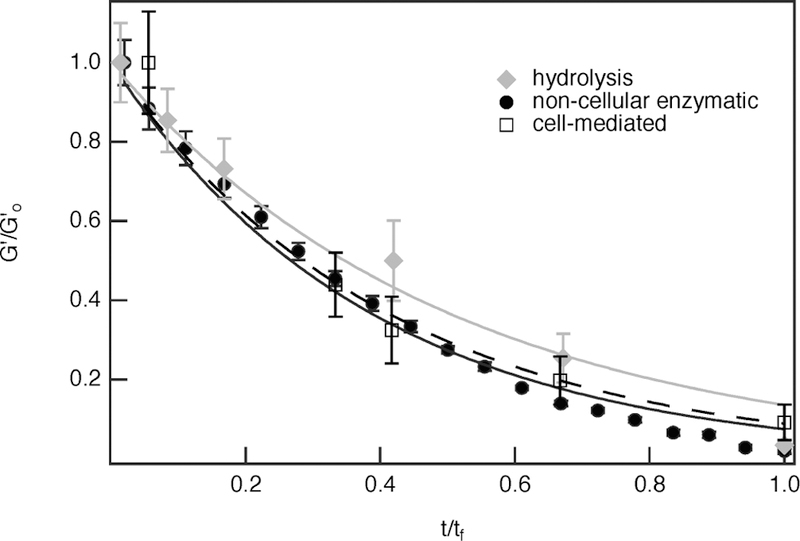
Comparison of hydrolytic (gray line), noncellular enzymatic (black, solid line), and cell-mediated (dashed line) scaffold degradation. The initial hMSC concentration in the cell-mediated degradation experiment is 2 × 10⁵ cells/mL.
Official websites use .gov
A
.gov website belongs to an official
government organization in the United States.
Secure .gov websites use HTTPS
A lock (
) or https:// means you've safely
connected to the .gov website. Share sensitive
information only on official, secure websites.
Comparison of hydrolytic (gray line), noncellular enzymatic (black, solid line), and cell-mediated (dashed line) scaffold degradation. The initial hMSC concentration in the cell-mediated degradation experiment is 2 × 10⁵ cells/mL.