
Figure 5.
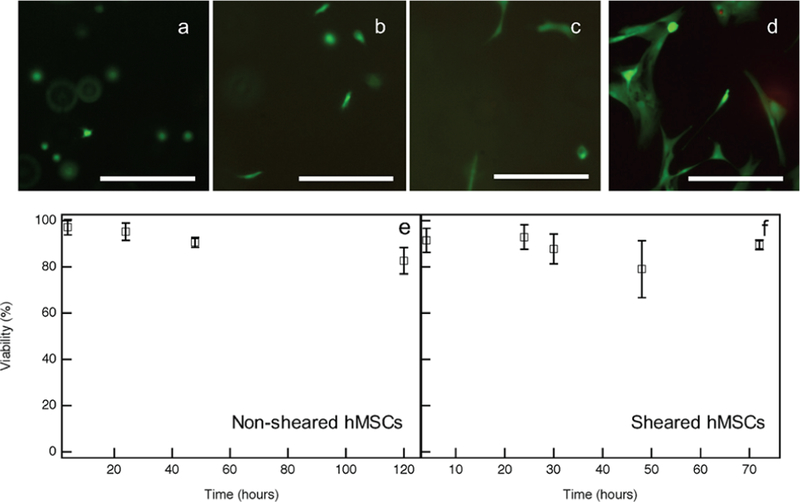
Incubation viability for hydrogels with encapsulated hMSCs quantified using a Live/Dead Assay. Fluorescent images of live hMSCs at (a) 4, (b) 24, (c) 48 and (d) 120 h after hMSC encapsulation. Data and images show a high viability and increased motility with time. Scale bars are 250 μm. hMSC viability as a function of time (shown as percent of viable cells) for (e) non-sheared and (f) sheared hMSCs.