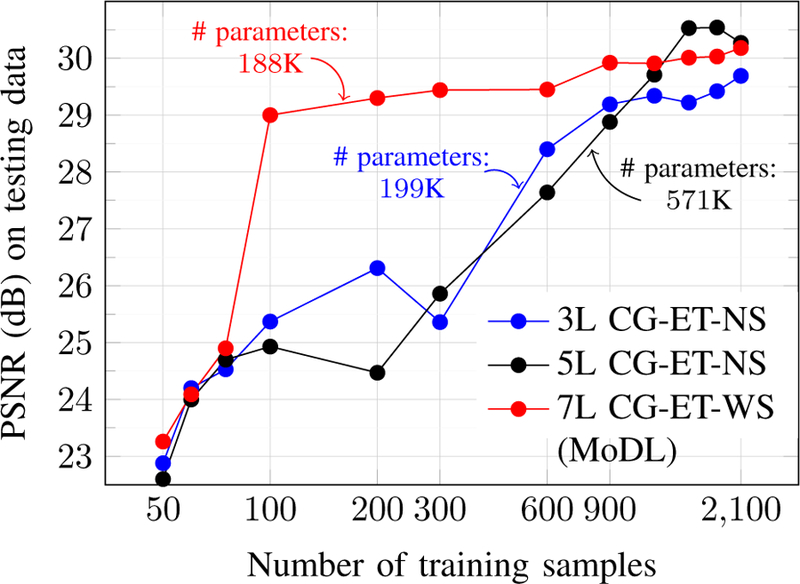
Fig. 3.

Effect of training dataset size. The x-axis is shown on the logarithmic scale. nL in the legend represents that n layer model was used. Figure shows the change in PSNR values on the testing data as we increase the training dataset size from 50 samples to 2100 samples.
