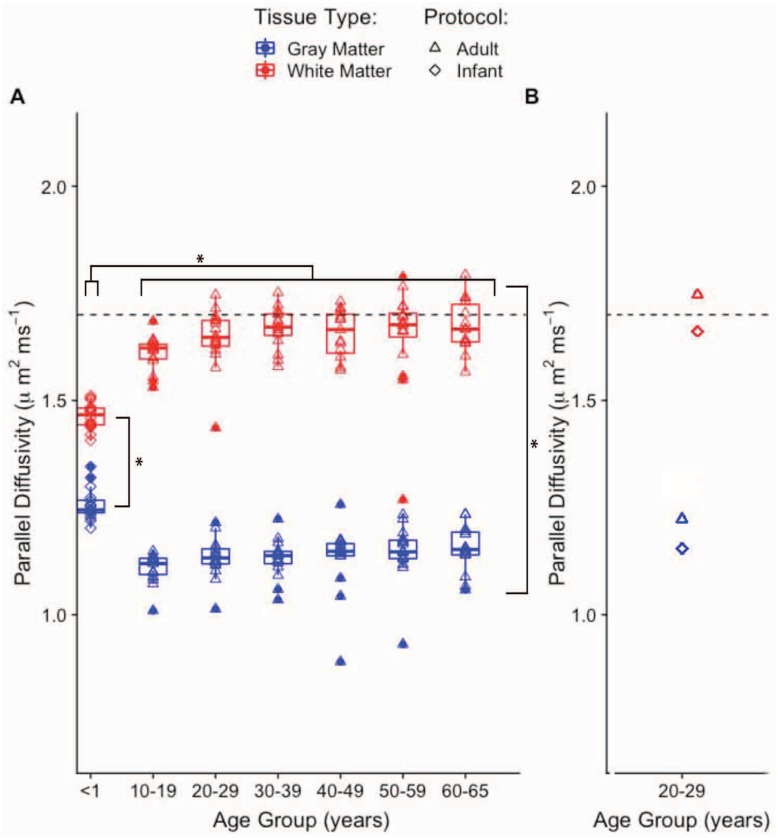
Fig 4. Optimized d∥ as function of age group and tissue type.
(A) Mean value of optimal d∥ as function of age group and tissue type. The scanning protocol for the <1 year group is slightly different than that of the rest of the groups (Table 1). The numbers from scanning one adult with the two protocols are shown in B. The dashed horizontal line marks the default d∥ value.

